


Gold and silver prices have retraced higher to a pivot level that may drive them lower. EURUSD, USDJPY, NZDUSD looking for support in bullish patterns.
The video above is a recording of a US Opening Bell webinar from March 25, 2019. We focused on the Elliott Wave patterns for key markets such as SP 500, gold, silver, DXY, EURUSD, NZDUSD, AUDUSD, and GBPUSD.
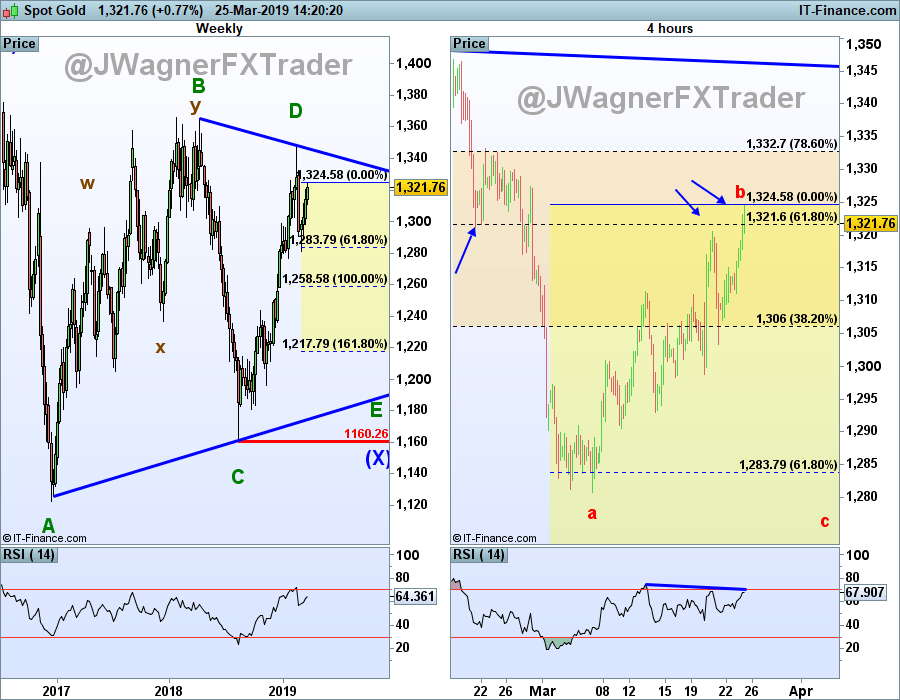
Gold prices are nearing an potential pivot point
The gold price chart is showing many symptoms of a near term bearish reversal. First, gold prices are currently parked on the 61.8% Fibonacci retracement level from the February 2019 high to March 2019 low. This is a common level where markets tend to reverse. Notice how this level near $1321 has produced previous swing low/highs (blue arrows)?
Secondly, driving into this resistance zone, we see evidence of the Relative Strength Index (RSI) diverging. This is also a common occurrence near the end of trends.
Lastly, when we analyze the gold chart through the lens of Elliott wave theory, it appears gold prices may soon reverse lower towards $1258 and possibly $1218. The labeling on the chart below shows the current Elliott wave count for gold as wave ‘b’ of zigzag ‘E’. This dip lower in gold, if it occurs, would be the last leg of the three year-long Elliott wave triangle which we are showing as wave (X). Therefore, once complete, would lead to a multi-month rally for gold. This view is valid so long as gold prices remain above $1160.
Therefore, our forecast from three weeks ago remains valid that gold and silver may continue to trade on their heel s for a bit more.
Read more…
Top gold trading strategies and tips
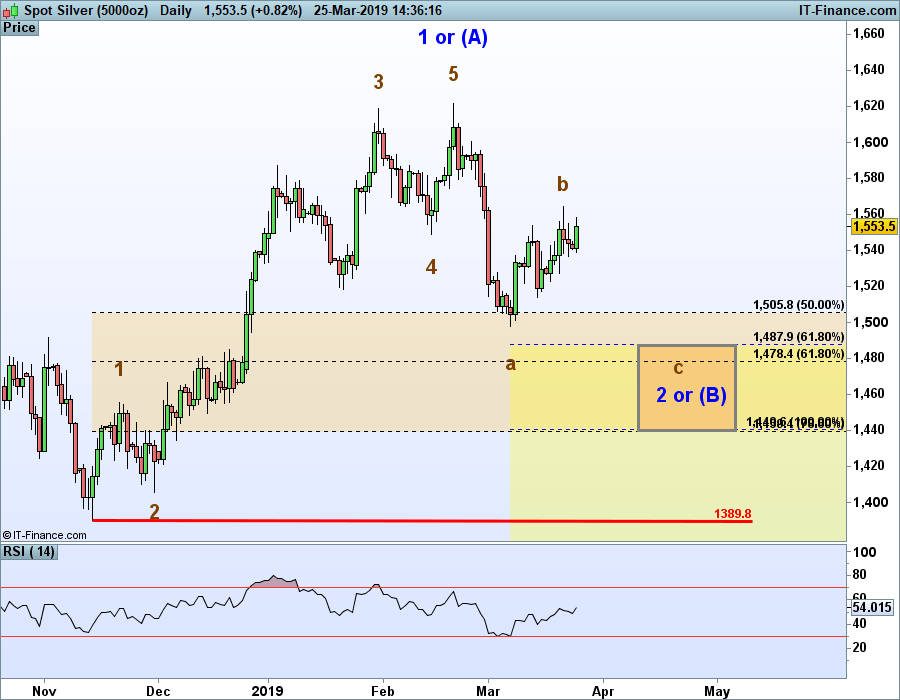
Silver prices in a similar Elliott wave pattern as gold prices
Silver prices are similar to gold in that the current rally best counts as a ‘b’ wave of a zigzag pattern. This suggests a ‘c’ wave lower is on the horizon from levels not too far from current pricing to complete the bearish zigzag pattern. Once this zigzag pattern is completed, it is highly probable that correction from February 20 is also completed leading to a mutli-month rally.
Using Elliott wave relationships, we forecast this ‘c’ wave to fall towards 14.40-14.80. From there, we are anticipating a rally to above 16.20 and possibly to 17.00 while holding above 13.89.
Read more…
Trading the gold-silver ratio: strategies and tips
EUR/USD broke key level of 1.1420
Last week, we wrote how a EUR/USD move above 1.1368 becomes an early warning signal for a break above 1.1420. A break above 1.1420 opens the door for further gains towards 1.17-1.20. Well, EURUSD did break 1.1420. The subsequent correction may simply be a wave (ii) of a larger advancing impulse wave. If so, then 1.17-1.20 remains in site.
The risk to this forecast is if EUR/USD falls below 1.1176. At this point, we will need to reconsider the Elliott wave count and elevate the probability the break of 1.1176 is a wave (iii) of a bearish motive wave.
Bottom line, 1.1176 is the key level for bulls. If the bearish count is to take hold, then EURUSD will struggle to rally.

NZD/USD Builds on Bullish momentum
We wrote in an analyst pick two week’s ago how the Elliott wave triangle pattern may have finalized. This forecast has continued to hold up with NZDUSD advancing to its highest level in 7 weeks. We are anticipating further gains with .7090 and .7298 price zones where wave relationships exist.
If NZDUSD were to unexpectedly fall below .6814, then some other wave pattern is at play.

USDJPY falls but longer term bullish pattern remains
The multi-year bullish forecast yielded on January 3 remains in place despite the recent correct by USDJPY. The current Elliott wave count for USDJPY shows the dip as wave 2 of a bullish impulse wave. Therefore, we are anticipating a wave 3 higher to new highs above 112 that may work up towards 117-122.

Elliott Wave Theory FAQ
How does Elliott Wave theory work?
Elliott Wave theory is a trading study that identifies the highs and lows of price movements on charts via wave patterns. Traders analyze the waves for 5-wave moves and 3-wave corrections to determine where the market is at within the larger pattern. Additionally, the theory maintains three rules and several guidelines on the depth of the waves related to one another. Therefore, it is common to use Fibonacci with Elliott Wave analysis. We cover these topics in our beginners and advanced Elliott Wave trading guides.
After reviewing the guides above, be sure to follow future Elliott Wave articles to see Elliott Wave Theory in action.
Not sure if Elliott wave is right for you? Believe it or not, when I first started trading I couldn’t understand why technical analysis worked. Now, I’m 100% technical through Elliott wave. Learn more about how Jeremy got started into Elliott wave from his podcast interview on Trading Global Markets Decoded with Tyler Yell.
---Written by Jeremy Wagner, CEWA-M
Jeremy Wagner is a Certified Elliott Wave Analyst with a Master’s designation. Jeremy provides Elliott Wave analysis on key markets as well as Elliott Wave educational resources. Read more of Jeremy’s Elliott Wave reports via his bio page.
Join Jeremy in his live US Opening Bell webinar where these markets and more are discussed through Elliott wave theory.
Follow Jeremy on Twitter at @JWagnerFXTrader .
Recent Elliott Wave analysis you might be interested in…
WTI Crude Oil Reaches a Decision Point on Price Chart


