


S&P 500 Elliott wave patterns are still leaning to the bearish side over the medium time horizon. NZDUSD may continue to pop higher in a bullish pattern.
The video above is a recording of a US Opening Bell webinar from March 18, 2019. We focused on the Elliott Wave patterns for key markets such as SP 500, gold, silver, DXY, EURUSD, NZDUSD, AUDUSD, and USDZAR.
two of three favored S&p 500 patterns point to December low retest
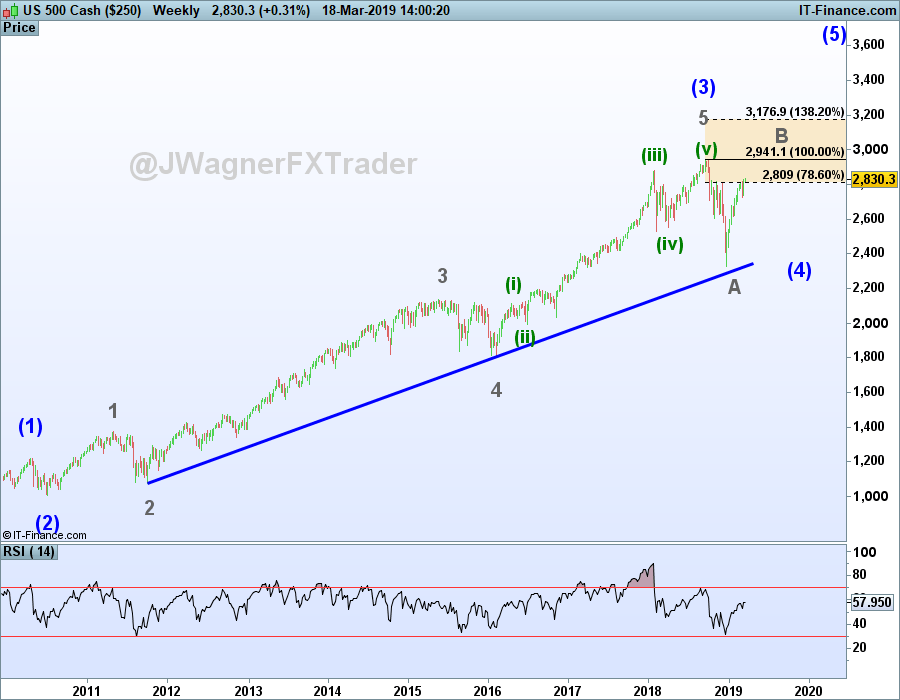
S&P 500 gave only a small hesitation last week to the horizontal resistance near 2820. There are three main Elliott wave counts being followed…we cannot confidently eliminate any of them at this time.
The larger degree Elliott wave patterns we are following point to this rally as being a temporary bump higher. Even if S&P 500 breaks to a new all-time high, the elevated wave picture is that new highs are likely contained below 3,200. This doesn’t mean S&P 500 has to break to a new high, but if it does, the higher probability count is that this rally is a ‘B’ wave topping between now and 3,200.
This view leans towards an eventual retest of the December 2018 low in the following ‘C’ wave.
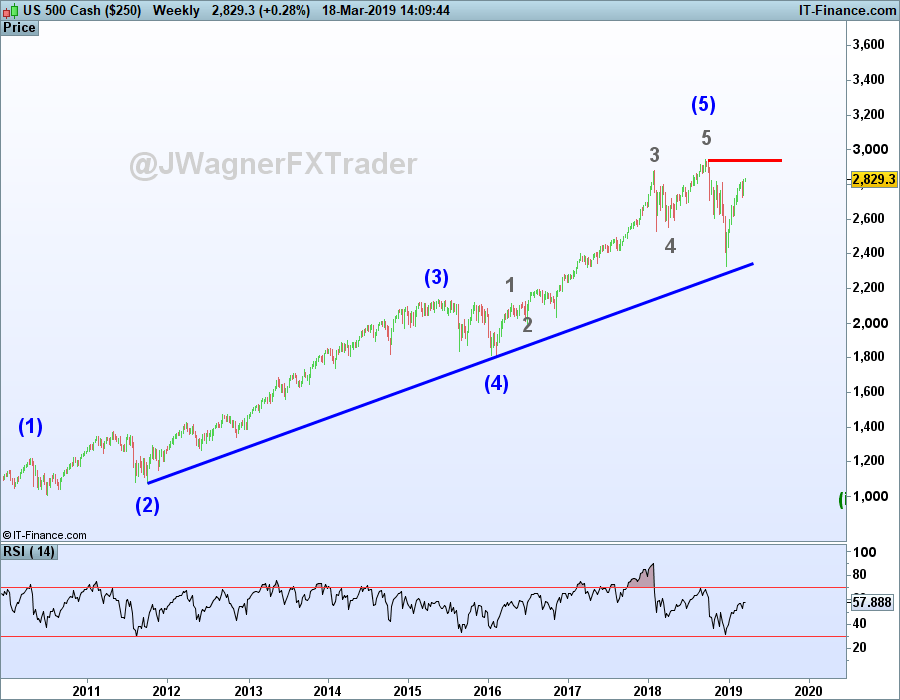
A secondary wave count being followed is that a long-term high was established in September/October 2018 and the market is preparing to fall hard and break below December’s low. This particular wave count is extremely bearish and points to levels below 1800.
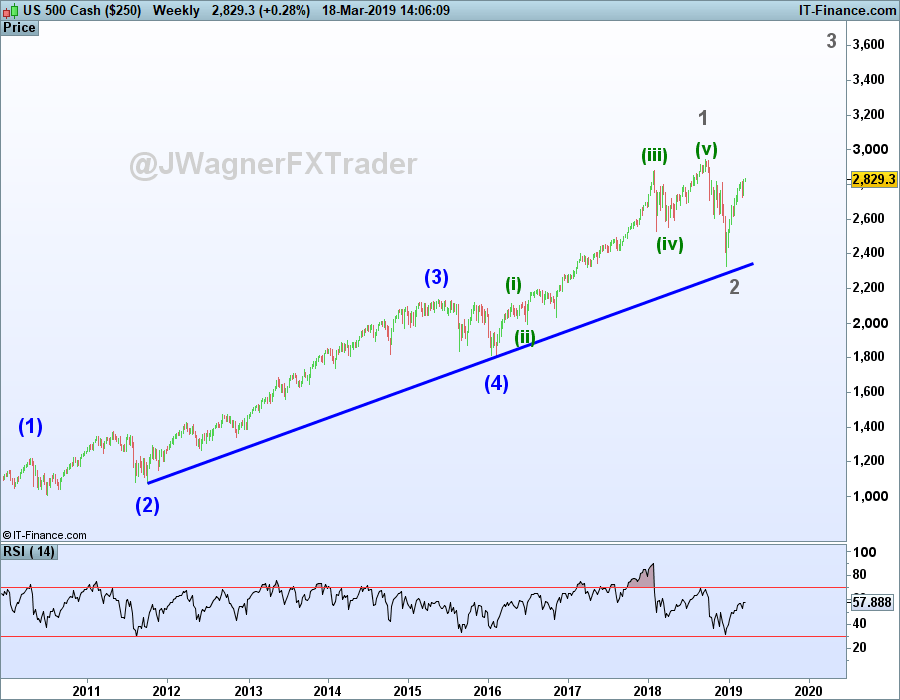
A third count we are following is that the high in September/October 2018 was wave 1 of (5). That implies correction in the latter part of 2018 was wave 2 of (5). This suggests a rally in wave 3 of (5) to new highs and beyond. This would be an extremely bullish scenario pointing towards higher levels for the bulk of calendar year 2019.
Read more…
Difference Between Dow, Nasdaq, and S&P 500
EUR/USD key level is 1.1420
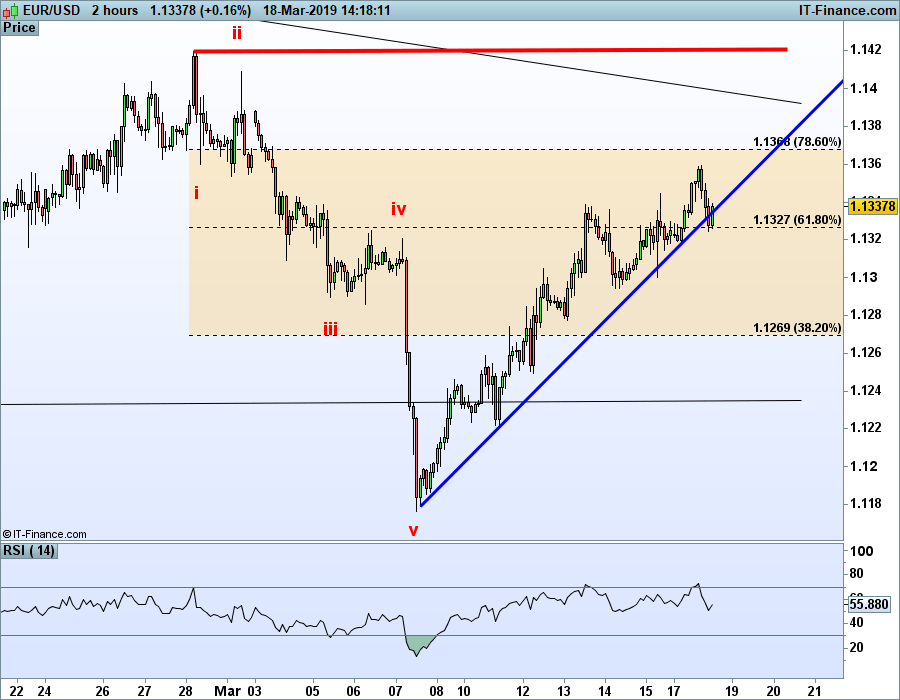
EUR/USD Elliott wave pattern can be interpreted as bullish or bearish. However, the key level for the bulls and bears is the February 28 high of 1.1420. So long as price remains below this level and more comfortably below the 78.6% retracement of 1.1368, then the bears have the upper hand. Above 1.1368 becomes an early warning signal that 1.1420 may break.
If EURUSD price moves above 1.1420, then we will consider a larger bullish move back towards 1.17-1.20 higher probability.
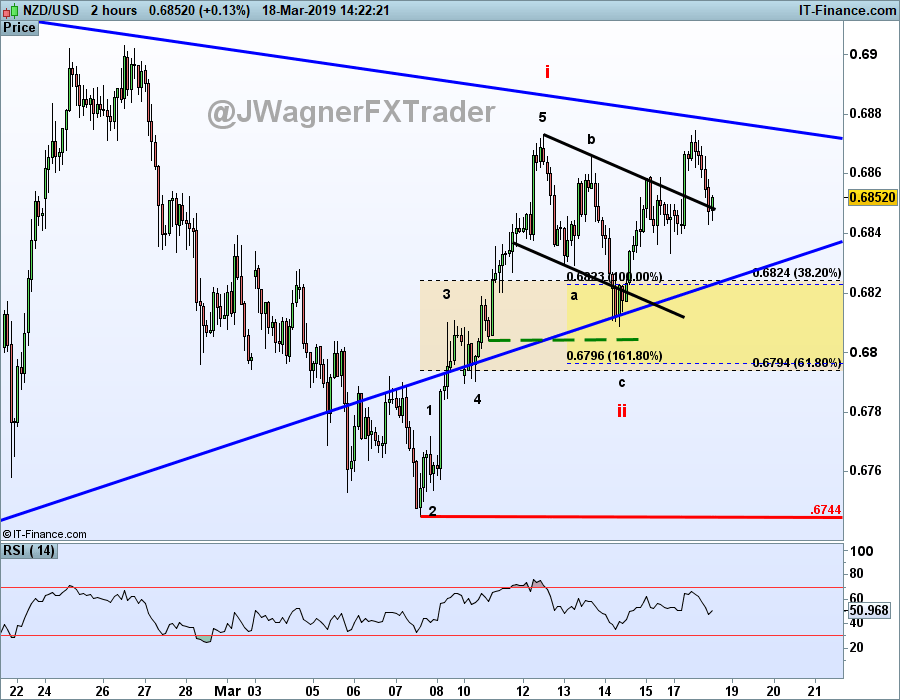
NZD/USD Tries to Bust Higher from Triangle Pattern
We wrote in an analyst pick last week how the Elliott wave triangle pattern may have finalized. So far this week, NZDUSD has added gains and we are anticipating higher levels yet towards .7090 and .7298. So long as NZDUSD holds above .6744, respect the potential for higher prices.
Elliott Wave Theory FAQ
How does Elliott Wave theory work?
Elliott Wave theory is a trading study that identifies the highs and lows of price movements on charts via wave patterns. Traders analyze the waves for 5-wave moves and 3-wave corrections to determine where the market is at within the larger pattern. Additionally, the theory maintains three rules and several guidelines on the depth of the waves related to one another. Therefore, it is common to use Fibonacci with Elliott Wave analysis. We cover these topics in our beginners and advanced Elliott Wave trading guides.
After reviewing the guides above, be sure to follow future Elliott Wave articles to see Elliott Wave Theory in action.
Not sure if Elliott wave is right for you? Believe it or not, when I first started trading I couldn’t understand why technical analysis worked. Now, I’m 100% technical through Elliott wave. Learn more about how Jeremy got started into Elliott wave from his podcast interview on Trading Global Markets Decoded with Tyler Yell.
---Written by Jeremy Wagner, CEWA-M
Jeremy Wagner is a Certified Elliott Wave Analyst with a Master’s designation. Jeremy provides Elliott Wave analysis on key markets as well as Elliott Wave educational resources. Read more of Jeremy’s Elliott Wave reports via his bio page.
Follow Jeremy on Twitter at @JWagnerFXTrader .
Recent Elliott Wave analysis you might be interested in…
WTI Crude Oil Reaches a Decision Point on Price Chart
USD/ZAR Has Biggest Monthly Gain Since August – More to Come?


