


Elliott wave crude oil price talking points:
- We are anticipating this crude oil price advance to be a corrective and a partial retracement of the October to December decline
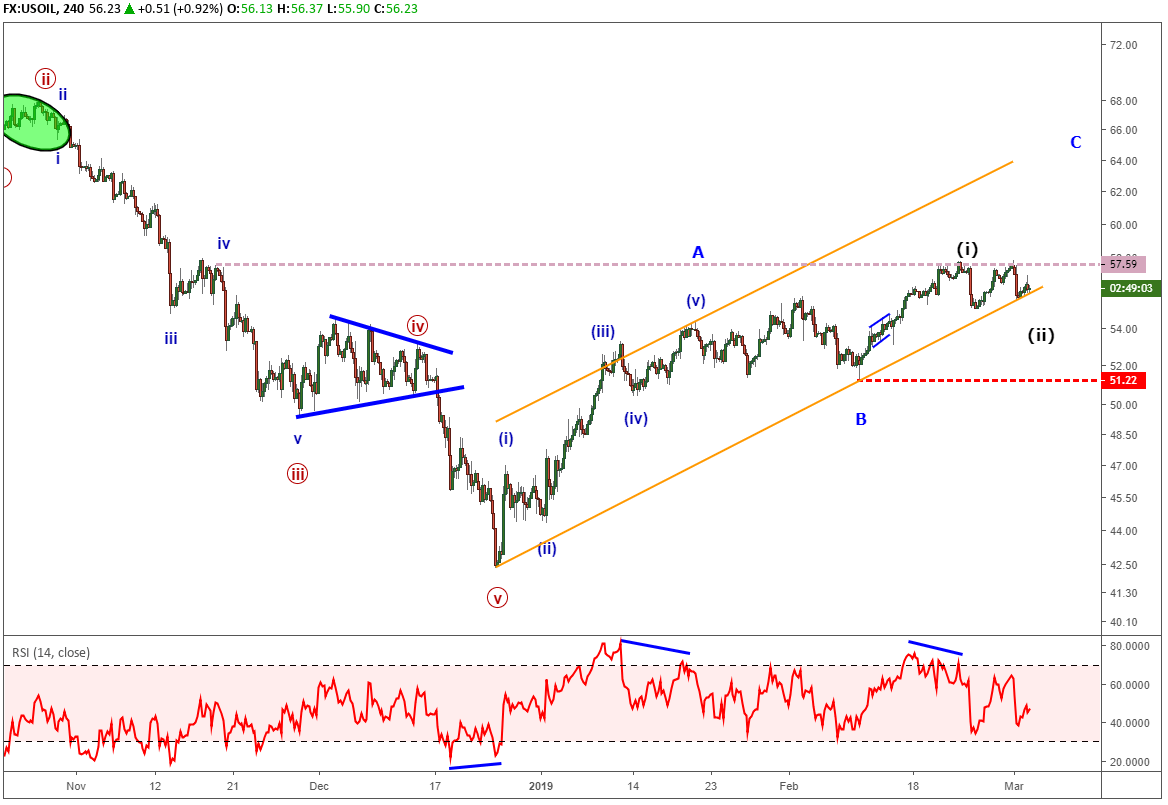
- A break to new highs above $58 may push up to the upper 60’s
- A break below the trend line opens the door for $51 and possibly $40
Though the rally is large, Crude Oil’s longer-term wave is still lower
Our previous longer-term Elliott wave forecast for crude oil from October 3 suggested a meaningful top may form near 77.31 or possibly 80. We later know that a high was formed that day at 76.88 in route to a 35% decline.
The subsequent decline to end 2018 was sharp and abrupt making it an Elliott wave impulse pattern. We were a little premature in looking at the bottom of the impulse pattern on December 4. That wave ended up being the fourth wave of the bearish impulse leaving one more dip to finalize the wave. This impulse pattern completed on December 24 and crude oil has rallied nearly 33% since.
what is the current Elliott wave for crude oil?
We recently wrote about 8 scenarios that tend to occur after an Elliott wave impulse pattern ends. Due to the positioning of the impulse wave and shape of the subsequent rally, the higher probability move is that crude oil is advancing in a zigzag pattern (scenarios 1,4 or 6). Crude oil appears locked into the ‘C’ wave of the zigzag pattern. Once the five waves of the ‘C’ wave are in place, we will look for another major high to form.
The February 22 high does complete five waves on a smaller scale so it is possible the corrective bounce is over. However, the length of ‘C’ relative to ‘A’ in the zigzag doesn’t fit the guidelines well. Therefore, we will consider the February 22nd high as wave (i) of ‘C’. Crude oil has traded sideways since so we are counting that range as wave (ii) of ‘C’. A break above $58 will build evidence of a rally in wave (iii) of ‘C’. Otherwise, a dip below the orange trend line suggests the mood of the market is changing and increases the probability a near term top is in place for crude oil.
How can I learn more about Elliott wave?
We have a beginners and advanced Elliott wave trading guides. Print off those guides and study the patterns. The two most comment patterns are impulse waves and zigzags. By understanding their structure and common Fibonacci relationships, you’ll have a great start to learning Elliott wave.
After reviewing the guides above, be sure to follow future Elliott Wave articles to see Elliott Wave Theory in action.
Not sure if Elliott wave is right for you? Believe it or not, when I first started trading I couldn’t understand why technical analysis worked. Now, I’m 100% technical through Elliott wave. Learn more about how Jeremy got started into Elliott wave from his podcast interview on Trading Global Markets Decoded with Tyler Yell.
---Written by Jeremy Wagner, CEWA-M
Jeremy Wagner is a Certified Elliott Wave Analyst with a Master’s designation. These articles are designed to illustrate Elliott Wave applied to the current market environment. See Jeremy’s bio page for recent Elliott Wave articles to see Elliott Wave Theory in action.
Discuss this market with Jeremy in Monday’s US Opening Bell webinar.
Follow on twitter @JWagnerFXTrader .
Recent Elliott Wave analysis you might be interested in…
Gold and Silver Trade on their Heels
NZDUSD Elliott Wave Analysis: Triangle Takes Over
8 scenarios after an Elliott wave impulse pattern completes
Jeremy’s podcast Interview on his progression to being 100% technical through Elliott wave


