


The metals such as gold and silver appear to have finished a bullish wave as we forecast a further dip in pricing. USDJPY continues to rally in impulse and dip in corrective waves.
The video above is a recording of a US Opening Bell webinar from March 4, 2019. We focused on the Elliott Wave patterns for key markets such as Gold, Silver, Oil, SP 500, DXY, EURUSD, USDJPY, NZDUSD, AUDUSD and USDZAR.
Mood of Gold prices changes to lower
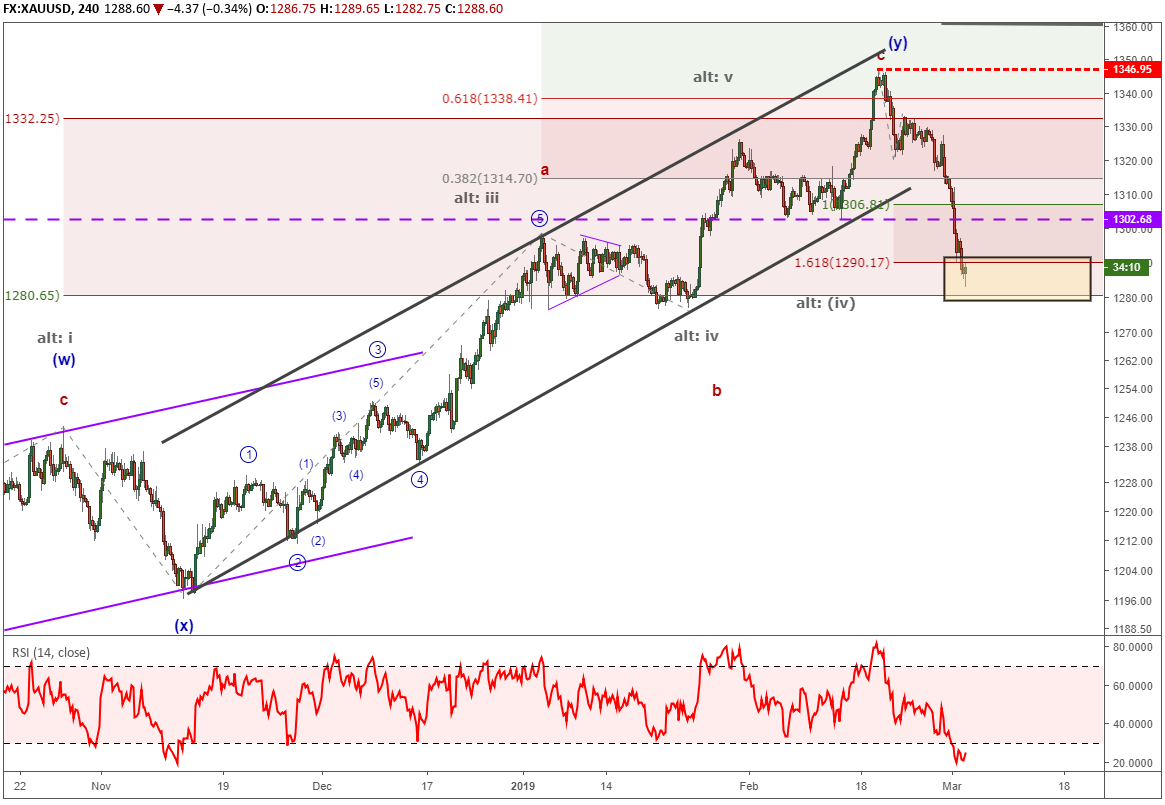
Gold prices have been steadily climbing higher since the US Dollar turned in mid-August 2018. However, the mood of the gold market appears to have changed as support trend lines are broken with the recent dip in gold prices from the past two weeks.
The February 19 high in gold appears to have completed the fourth wave in a sideways Elliott wave triangle pattern. This implies the fifth and final wave of the triangle is underway. So long as gold prices remain below $1347, we are forecasting gold may dip towards $1190-$1220 to finish the triangle pattern.
The Elliott wave pattern after the dip would call for another strong rally to new highs, but we’ll cross that bridge if we arrive at the lower levels cited.
Additional reading…
Top Gold Trading Strategies and Tips
Bitcoin vs Gold: Top Differences Traders Should Know
Silver prices completed an Elliott wave impulse
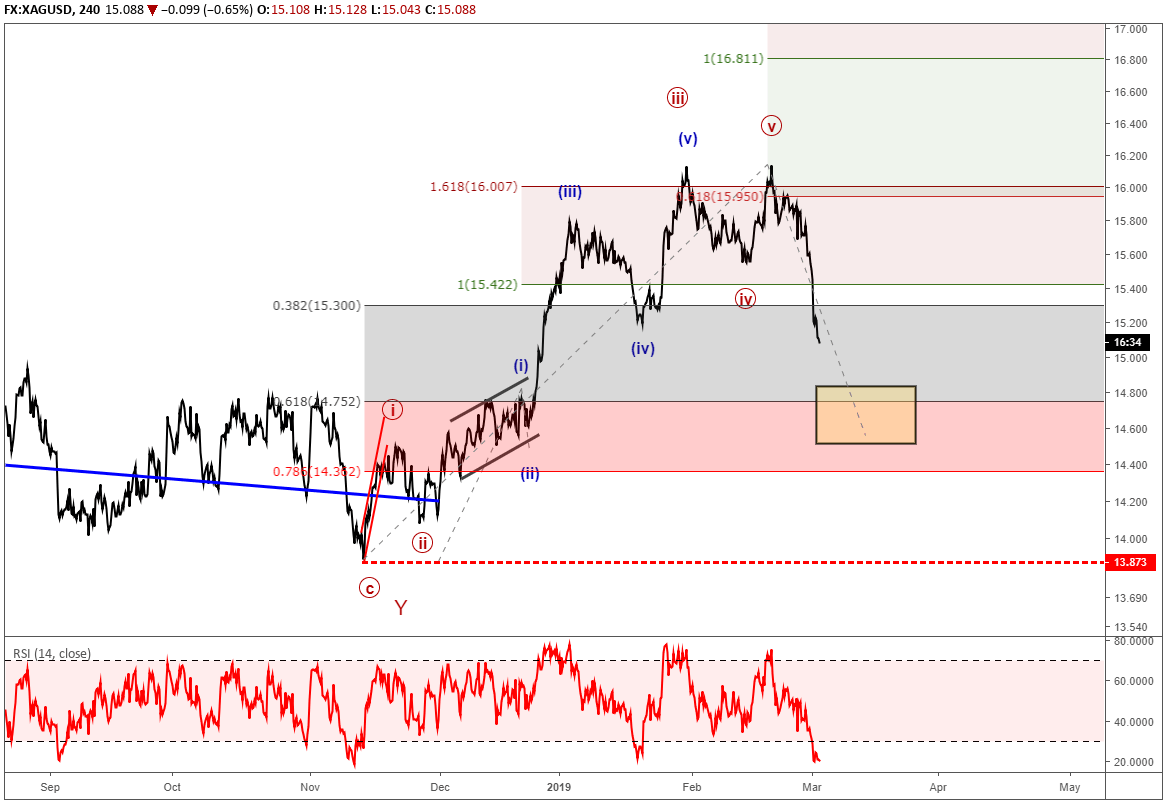
Silver prices completed an Elliott wave impulse pattern from November 2018 to February 20. Of the 8 scenarios that happen after a completed impulse wave, scenarios 1,4,6 apply to this situation. Therefore, the higher probability move is continued weakness in silver prices towards the 61.8% Fibonacci ratio sitting near 14.75. This isn’t an exact price zone and silver doesn’t need to fall that far for the longer term forecast to hold. Once this partial retracement lower exhausts, we are anticipating a rally to begin from lower levels to retest the 16.20 high and possibly higher levels like 17.
We will need to see how the price action develops to the downside as it will be used to help us establish upside targets.
Additional reading…
How to trade Silver: Top Silver Trading Strategies
USDJPY extends itself from the January low
After the Japanese Yen flash crash on January 2, we wrote how that outsized price action may have put a period at the end of a three year Elliott wave triangle pattern. If so, then USDJPY may be in the beginning stages of a multi-year rally.
USDJPY continues to advance in motive waves while dipping in corrective waves. This keeps the longer term USDJPY forecast in check as the near term bullish action supports longer term forecast for USDJPY.
NZDUSD grinds sideways in Elliott wave triangle pattern
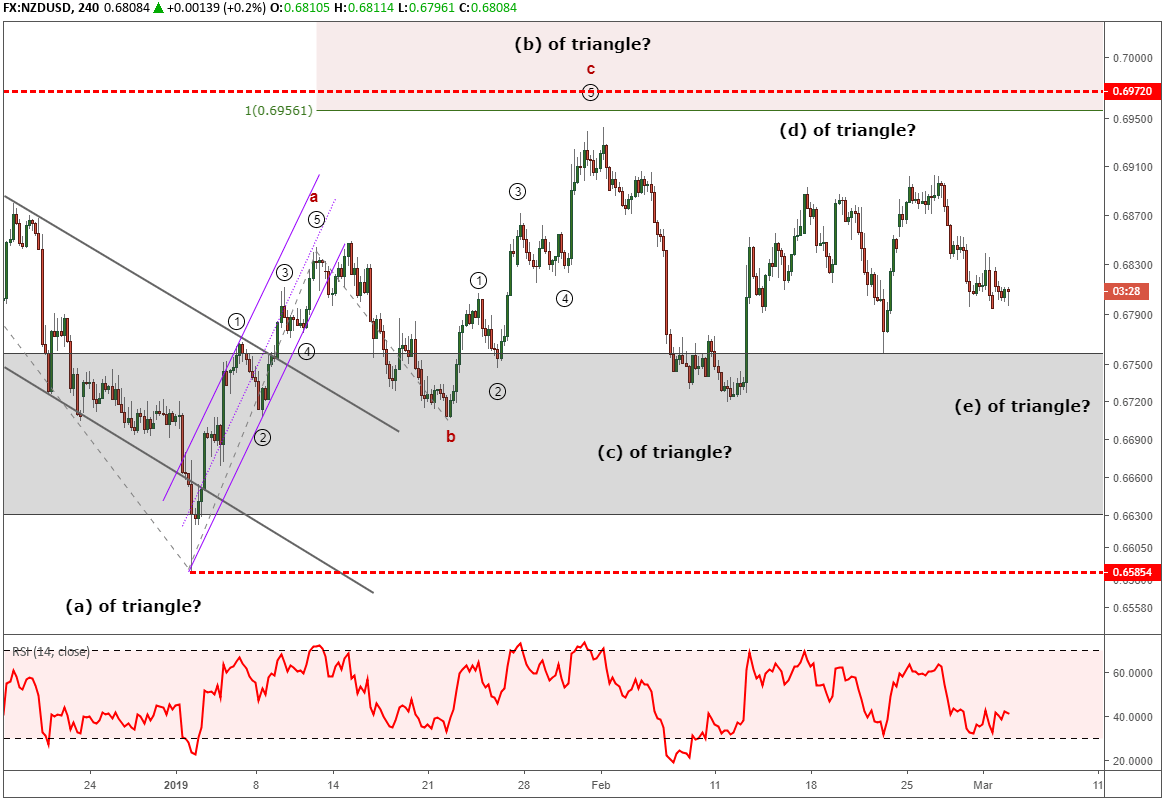
We have been tracking NZDUSD since November and the stalled price action is indicative of an Elliott wave triangle pattern. It is difficult to see how advanced this triangle pattern is and where its termination point is estimated to be. Regardless, this has the look of a bullish triangle so we bias our thinking to the up side.
Elliott Wave Theory FAQ
How does Elliott Wave theory work?
Elliott Wave theory is a trading study that identifies the highs and lows of price movements on charts via wave patterns. Traders analyze the waves for 5-wave moves and 3-wave corrections to determine where the market is at within the larger pattern. Additionally, the theory maintains three rules and several guidelines on the depth of the waves related to one another. Therefore, it is common to use Fibonacci with Elliott Wave analysis. We cover these topics in our beginners and advanced Elliott Wave trading guides.
After reviewing the guides above, be sure to follow future Elliott Wave articles to see Elliott Wave Theory in action.
Not sure if Elliott wave is right for you? Believe it or not, when I first started trading I couldn’t understand why technical analysis worked. Now, I’m 100% technical through Elliott wave. Learn more about how Jeremy got started into Elliott wave from his podcast interview on Trading Global Markets Decoded with Tyler Yell.
---Written by Jeremy Wagner, CEWA-M
Jeremy Wagner is a Certified Elliott Wave Analyst with a Master’s designation. Jeremy provides Elliott Wave analysis on key markets as well as Elliott Wave educational resources. Read more of Jeremy’s Elliott Wave reports via his bio page.
Follow Jeremy on Twitter at @JWagnerFXTrader .
Recent Elliott Wave analysis you might be interested in…
8 scenarios after an Elliott wave impulse pattern completes
Jeremy’s podcast Interview on his progression to being 100% technical through Elliott wave


