


JPY Elliott Wave Talking Points:
- Yen price action from earlier today tips the scales that a meaningful reversal is at hand
- Positioning long USD/JPY against the wick lows of today
- Markets may be driven higher by USD/JPY so follow other JPY crosses like EURJPY and GBPJPY
Yen pairs woke up from a holiday slumber as a flash crash moved JPY against several counterparts between 400-550 pips for the day’s range. Though we were not anticipating a flash crash, our Elliott wave price action studies pointed towards lower levels for USD/JPY and EUR/JPY. Those targets have been reached. We have enough evidence to consider a meaningful low is in place and a large multi-month rally may begin for most JPY pairs…USD/JPY is likely the market that drives them all higher.
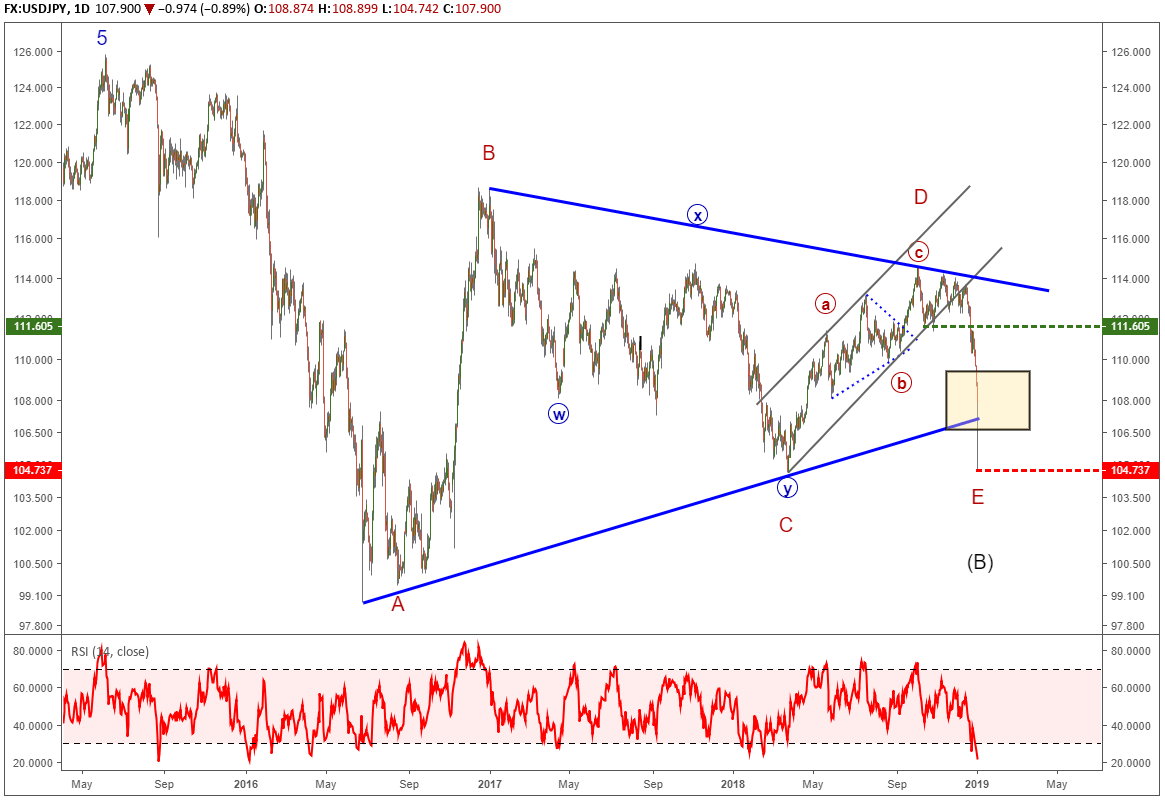
The current Elliott Wave for USDJPY
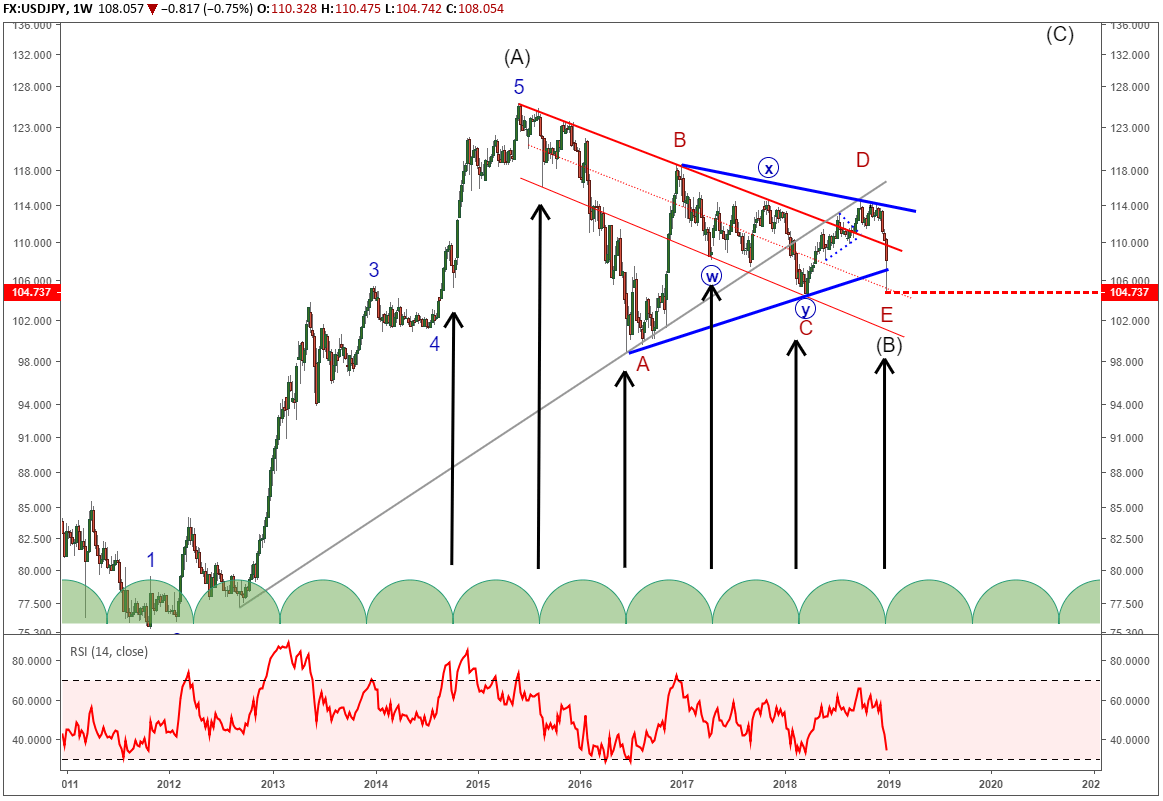
Bigger picture, we can count an Elliott wave triangle pattern complete at today’s low. Based on the price action from October 2011, the triangle appears to be the (B) wave of a large bullish zigzag pattern. This implies a rally in wave (C) of the zigzag to 126 and possibly 150 while holding above today’s low.
Bullish Bias: 106-108
Key Risk Level : 104.70 (Jan 2, 2019 low)
First Target : 125.00 (June 2015 high)
Secondary Target : 135.00 (Feb 2002 high and wave relationship to 2011-2015 wave)
Third Target : 150.00 (Equal wave to 2011-2015 impulse wave)
How can we be certain the low is in for USDJPY?
We never really know for sure until the moves are nearly over. Therefore, we look for clues and symptoms of the Elliott wave patterns.
We identified a downward corrective cycle on October 3 that had the potential to be an ending wave of the three year Elliott wave triangle. We subsequently tracked USDJPY lower in this cycle through November and December. Many times, the final ‘E’ leg of the Elliott wave triangle will overshoot the trend line connecting the ‘A’ and ‘C’ point. Today’s price action fits this description.
To make things more interesting, we also identified on October 10 a timing cycle that pointed towards December 2018 as a potential time when the down cycle may terminate. I rarely talk about timing cycles unless they are obvious. Though today is January 3, it can be reasonably considered within the timing window. Timing cycles are to be seen as secondary in nature as we follow the price action and Elliott wave patterns first and foremost. With that said, we have price action and timing nearly lining up so the bullish potential needs to be respected.
A move above the October 15 low of 111.63 in impulsive wave fashion would be a symptom of the low being in place.
How might this affect other JPY markets?
Due to the strong bullish potential of USDJPY, it is possible USDJPY may drag other markets higher with it like EURJPY and possibly GBPJPY.
Regarding EURJPY, in mid-December, I wrote in the Q1 2019 EUR forecast:
It appears a bearish Elliott wave pattern is unfolding from the September high with targets to the downside of 122.76 and 118.77-119.41. A weaker USD/JPY, rather than weaker EUR, will likely drive down a correction of that depth.
With EURJPY bottoming today at 118.82, I am considering the near-term correction over. As I assess the potential Elliott wave counts, many of them point to a big rally back towards the 128 zone. A couple of the wave counts point towards a complete retracement of the 2018 correction meaning new highs above 138 and possibly higher levels. If EURJPY can rally above 129, then I’ll elevate the probabilities of a retest to 138 and above.
Regarding GBPJPY, though we can count a bullish wave beginning from today’s low’s, that bullish count is met with other high probability counts that are bearish. The bearish scenarios imply a bearish reversal from below 139 for a retest of today’s lows. Above 146, the pressure from the bearish scenarios are relieved and probabilities shift heavier towards the bullish count.
Bottom line, if EURJPY rallies above 129 and GBPJPY rallies above 146, then we may see a large wave of JPY weakness forcing USDJPY, EURJPY, and GBPJPY higher.
Elliott Wave FAQs
How does Elliott Wave theory work?
Elliott Wave theory is a trading study that identifies the highs and lows of price movements on charts via wave patterns. Traders analyze the waves for 5-wave moves and 3-wave corrections to determine where the market is at within the larger pattern. Additionally, the theory maintains three rules and several guidelines on the depth of the waves related to one another. Therefore, it is common to use Fibonacci with Elliott Wave analysis. We cover these topics in our beginners and advanced Elliott wave trading guides.
---Written by Jeremy Wagner, CEWA-M
Jeremy Wagner is a Certified Elliott Wave Analyst with a Master’s designation. These articles are designed to illustrate Elliott Wave applied to the current market environment. See Jeremy’s bio page for recent Elliott Wave articles to see Elliott Wave Theory in action.
Communicate with Jeremy and have your shout below by posting in the comments area. Feel free to include your Elliott Wave count as well.
Discuss this market with Jeremy in Monday’s US Opening Bell webinar.
Follow on twitter @JWagnerFXTrader .
Learn more about how Jeremy got started into Elliott wave from his podcast interview on Trading Global Markets Decoded podcast with Tyler Yell. You can access through:
Stitcher - https://www.stitcher.com/podcast/trading-global-markets-decoded-with-dailyfx/e/57431393
itunes - https://itunes.apple.com/us/podcast/trading-global-markets-decoded/id1440995971
Recent Elliott wave articles
S&P 500 Peeks Below Trend Line Jeoparding 10 Year Uptrend
Ethereum Price Forecasted to see Large Gain using Elliott Wave Analysis


