


USDJPY Elliott Wave Talking Points:
- USD/JPY is pressing the upper bounds of a shorter term bearish pattern
- Anticipate a bearish reversal from nearby levels that may drive USDJPY to 111 and possibly 108
- A break above 114.27 negates this pattern and we’ll reconsider further bullish opportunities
USD/JPY has been remained relatively supported for the past 2 months. Our recent post on USDJPY Elliott wave from November 8 was that we were anticipating a bearish turn near 114. We did get a brief dip lower beginning November 12 that has since popped back higher. Bigger picture, we think USDJPY is in a downward corrective cycle since October 3 that may drive the pair towards much lower levels.
The current Elliott Wave for USDJPY
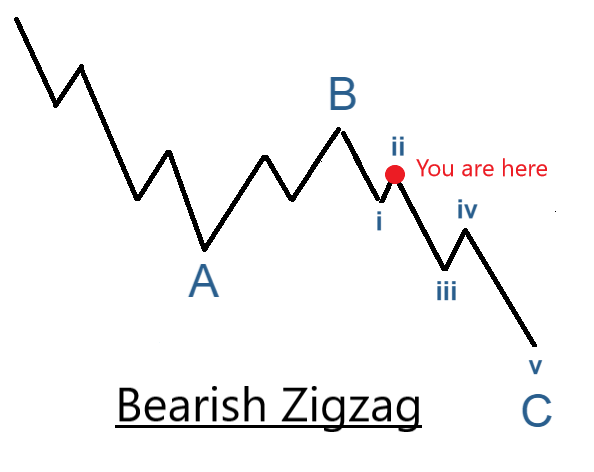
New to Elliott wave corrective patterns? On page 5 of our Elliott wave advanced guide, we explain Zigzag’s and where they commonly occur.
We are anticipating an a-b-c zigzag pattern lower that began October 3. This zigzag pattern would make up the ‘E’ leg of a larger triangle pattern that began from the 2015 high. We believe the ((b)) leg of the zigzag completed on November 12 and that USDJPY prices are slowly working themselves lower. We are counting the current rise of USD/JPY to be wave (ii) of ((c)) meaning wave (iii) lower may begin from nearby levels.
If this pattern is the correct one, then USDJPY will continue to move lower in wave ((c)) of E that retests the 111 lows and possibly lower levels.
Why does Elliott Wave Theory identify a reversal near current levels?
Since the trend that began November 12 appears to be a bearish impulse wave into the November 20 low, it is highly probable that the current rise stops prior to the 114.27 high which is near where the 78.6% Fibonacci retracement level is.
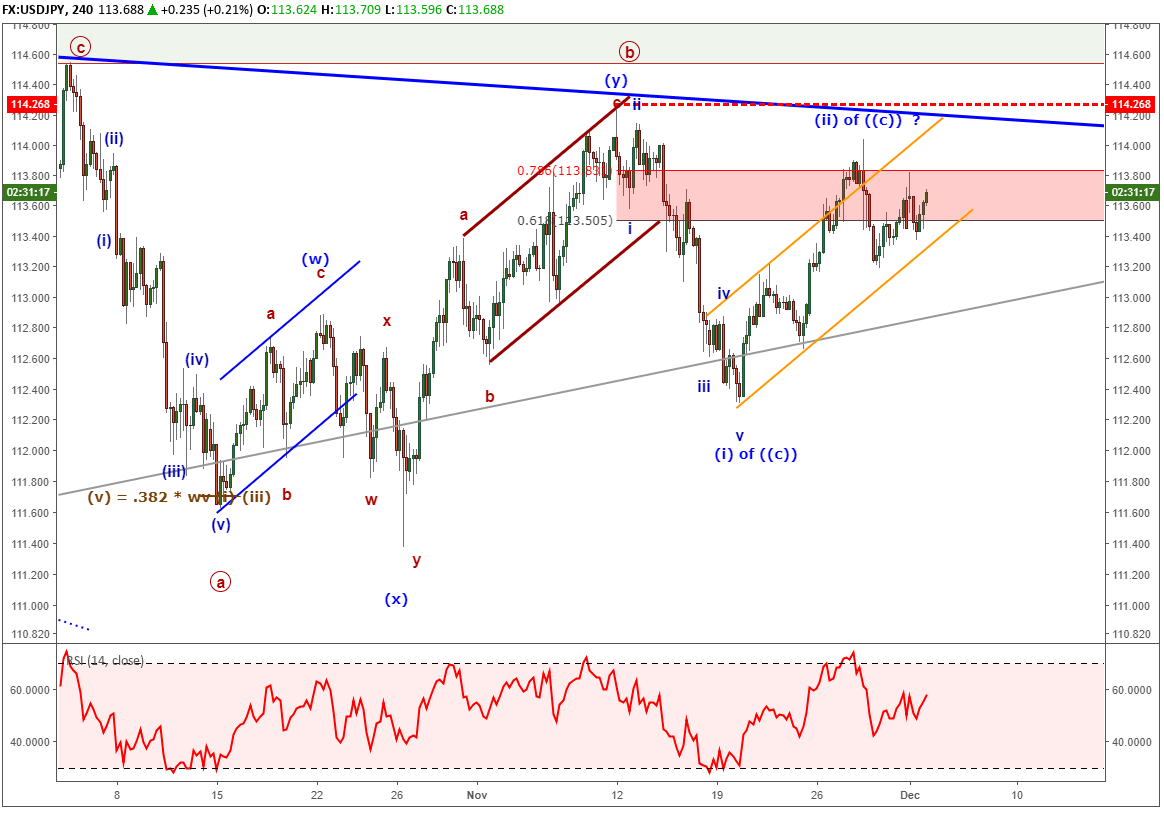
If USD/JPY does move lower, we would first like to see the orange support channel broken to alert the possibility of a new bearish trend. Similarly, if we see live client sentiment turn positive, then that would add additional confirmation for the potential of a deeper move lower. Current client sentiment is at -1.4 as only 42% of traders are long.
If USDJPY does continue higher and break above 114.27, then this Elliott wave pattern is voided, and we will consider other alternate counts such as a more complex ‘D’ leg of a larger triangle pattern.
Elliott Wave FAQs
Where can I learn more about Elliott Wave Theory and how to trade with it?
Elliott Wave Theory is a study of waveforms, patterns, and wave structure. The rules and guidelines are simple and can be found in these beginner and advanced Elliott Wave guides. The challenge with Elliott Wave principle is identifying and interpreting the waveforms in real time. As a result, I would suggest you follow the webinars and articles DailyFX has devoted to Elliott Wave Theory.
---Written by Jeremy Wagner, CEWA-M
Jeremy Wagner is a Certified Elliott Wave Analyst with a Master’s designation. These articles are designed to illustrate Elliott Wave applied to the current market environment. See Jeremy’s bio page for recent Elliott Wave articles to see Elliott Wave Theory in action.
Communicate with Jeremy and have your shout below by posting in the comments area. Feel free to include your Elliott Wave count as well.
Discuss this market with Jeremy in Monday’s US Opening Bell webinar.
Follow on twitter @JWagnerFXTrader .
RECENT ELLIOTT WAVE ARTICLES
S&P 500 Still Below Resistance; ETH and XRP Continue to Fall
Ethereum Price Forecasted to see Large Gain using Elliott Wave Analysis


