FTSE 100, Dow Jones 30, Nasdaq 100 - Analysis and Charts
FTSE 100 rallies above 8300
The index’s huge gains have continued, and the previous week saw the price hit new records. Further gains carry the price to new record highs, but with the price now significantly overextended from the 50-day simple moving average (SMA) by almost 5%, some near-term weakness cannot be ruled out.
A close back below 8100 might signal that some kind of retracement has begun.
FTSE 100 Daily Chart


Dow back above 50-day moving average
Monday saw the index open back above the 50-day SMA for the first time since 4 April. This continues the recovery from the lows of mid-April when the price touched a three-month low. Since then the price has added around 1500 points. Friday’s close above the mid-April high of around 38,600 continues to bolster the case for further upside.
Additional gains target the 39,287 level, the February high, while beyond this lies the record high just below 40,000.
DowJones Daily Chart

| Change in | Longs | Shorts | OI |
| Daily | -1% | -2% | -2% |
| Weekly | -8% | 6% | 2% |
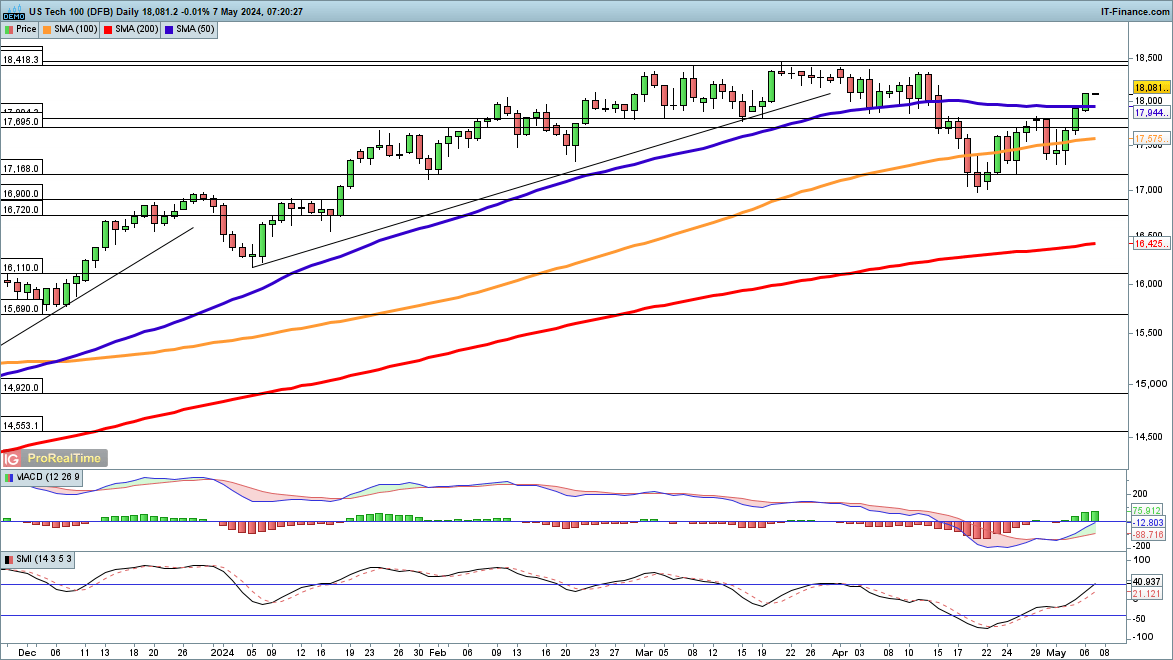
Nasdaq 100 pushes through mid-April high
This index also continues to make strong progress, completing a similar pattern to the Dow. It opened and closed above the 50-day SMA for the first time since early April, having similarly closed above its mid-April high (at 16,700).This leaves the index well-placed to target theprevious record highs from March and April around 18,420. Most of the big tech earnings are out of the way, removing one possible risk for the index.
A close back below 17,500 would be needed to negate this bullish view and suggest that another test of the 17,000 low from April could develop.
Nasdaq 100 Daily Chart