


FTSE 100, DAX 40, S&P 500 Analysis and Charts
Download our complimentary Q2 Equities Forecasts

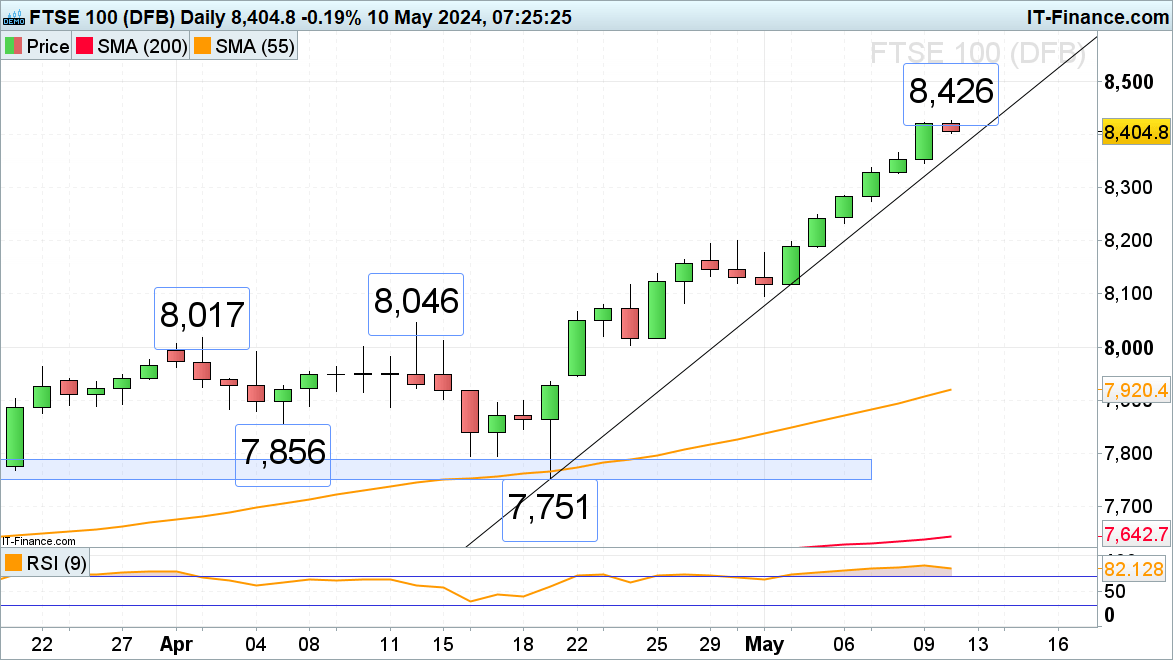
FTSE 100 has so far seen six straight days of record highs
The FTSE 100 has so far seen six straight days of gains with each making a new record high and may see a seventh on Friday as the UK exits its 2023 recession with better-than-expected 0.6% quarter-over-quarter GDP growth.
The psychological 8,500 mark represents the next upside target while the April-to-May uptrend line at 8,362 underpins.
FTSE 100 Daily Chart
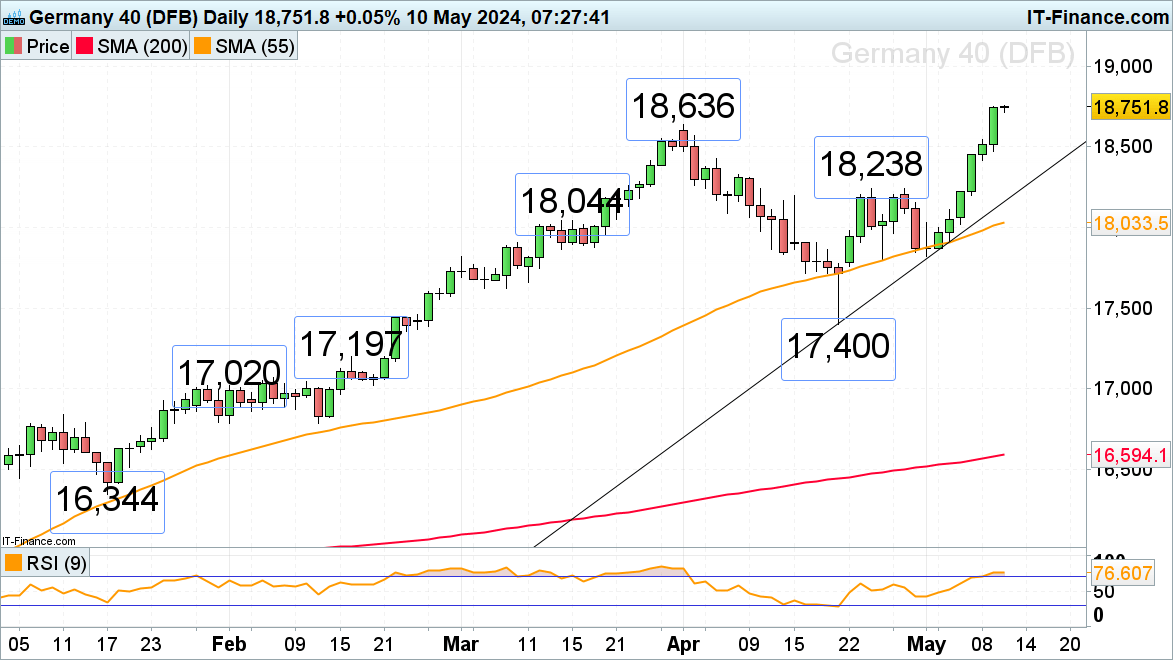
DAX 40 trades in new record highs
The DAX 40 has so far seen six consecutive days of gains which have taken it to a new record high on Friday morning with the 19,000 region being targeted.
Minor support can be spotted at the previous record high made in April at 18,636.
DAX 40 Daily Chart
| Change in | Longs | Shorts | OI |
| Daily | 16% | 4% | 7% |
| Weekly | 39% | -10% | -1% |
S&P 500 trades in one-month highs
The S&P 500’s 4% rally from its early May low has taken it above the 5,200 mark, close to the 10 April high at 5,234. Above it lies the April record high at 5,274.
Potential slips may encounter support at the 5,200 mark, hit on Tuesday, and at Wednesday’s 5,164 low.
S&P 500 Daily Chart


