


Dow Jones, Nasdaq 100, Nikkei 225 - Analysis and Charts
Dow rallies through 39,000
The index continued to make gains on Wednesday, moving above 39,000 and putting itself on a renewed course to test the record highs just below 40,000 after Tuesday’s indecisive session.
A higher low was formed in mid-April, and with buyers stepping in at month-end to defend the 37,820 level, the overall picture continues to support the case for further upside. A close back below 38,200 would negate this view and suggest another test of the late April low.
Dow Jones Daily Chart

| Change in | Longs | Shorts | OI |
| Daily | 29% | 0% | 5% |
| Weekly | -6% | 7% | 4% |
Nasdaq 100 edging down
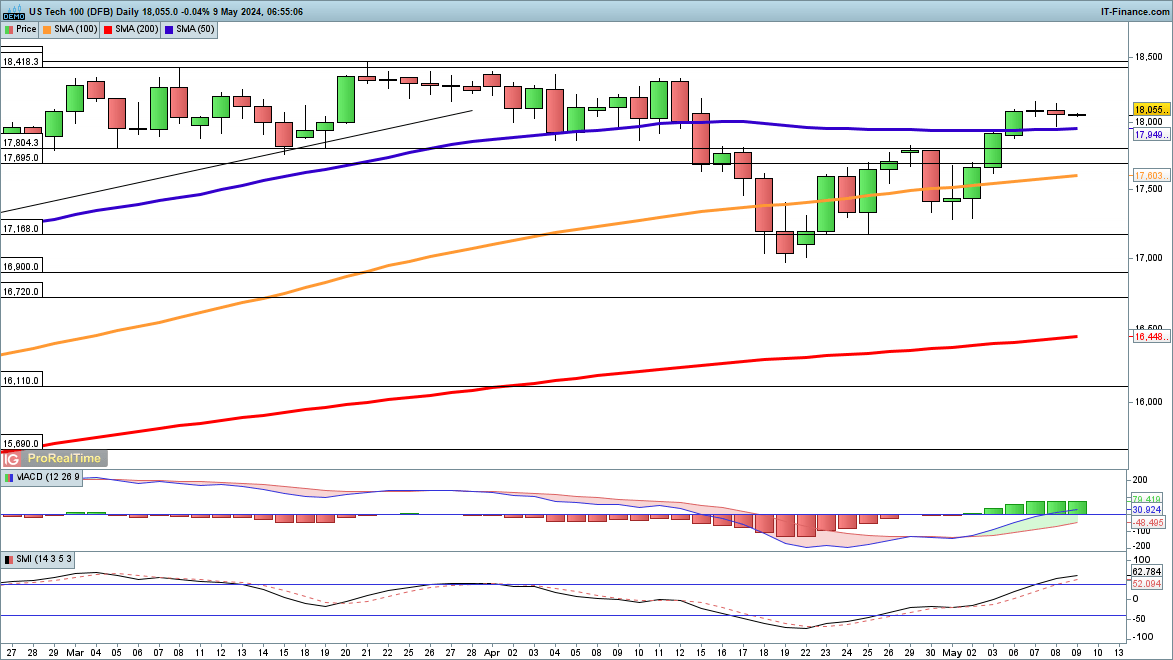
This index was unable to push on through Tuesday’s high, though buyers did step in to defend the lows and prevent a move below the 50-day simple moving average (SMA). The index is now within easy distance of the highs seen in March and April just below 18,500. Above this would see the price in new record high territory.
A close back below 17,700 would begin to suggest that a new push lower is underway.
Nasdaq100 Daily Chart

Nikkei 225 heads lower
The rebound from the lows of April has been stopped in its tracks over the past two sessions.Despite a weakening yen, the Nikkei 225 has hit some selling pressure, and the rally from the April low has stalled below 39,000 and the 50-day SMA.
A close back above 39,000 would help to revive the bullish view, and swiftly bring about a test of trendline resistance from the March highs. Trendline support from the April low comes into play around 38,000.
Nikkei 225 Daily Chart


