


Major Indices Roundup:
- Dow traded to a new six-week high but couldn't hold all of its gains
- Nasdaq posts a solid performance over the last month, slowing ahead of US CPI
- Hang Seng continues fine form, rising to levels last seen in August last year
- Get your hands on the Equities Q2 outlook today for exclusive insights into key market catalysts that should be on every trader's radar:

Dow at six-week high
While the index pushed to a new six-week high on Monday, it was unable to hold all its gains.
This is perhaps not surprising, given the strong bounce since mid-April, that has added around 2000 points to the index. With the US CPI print scheduled for Wednesday, buyers may find that the going becomes tougher in the short-term.
Nonetheless, further gains target the 39,964 high from late March, with the 40,000 mark tantalisingly close by. A close back below the mid-April high of 38,590 might suggest that another test of recent lows could occur.
Dow Jones Daily Chart
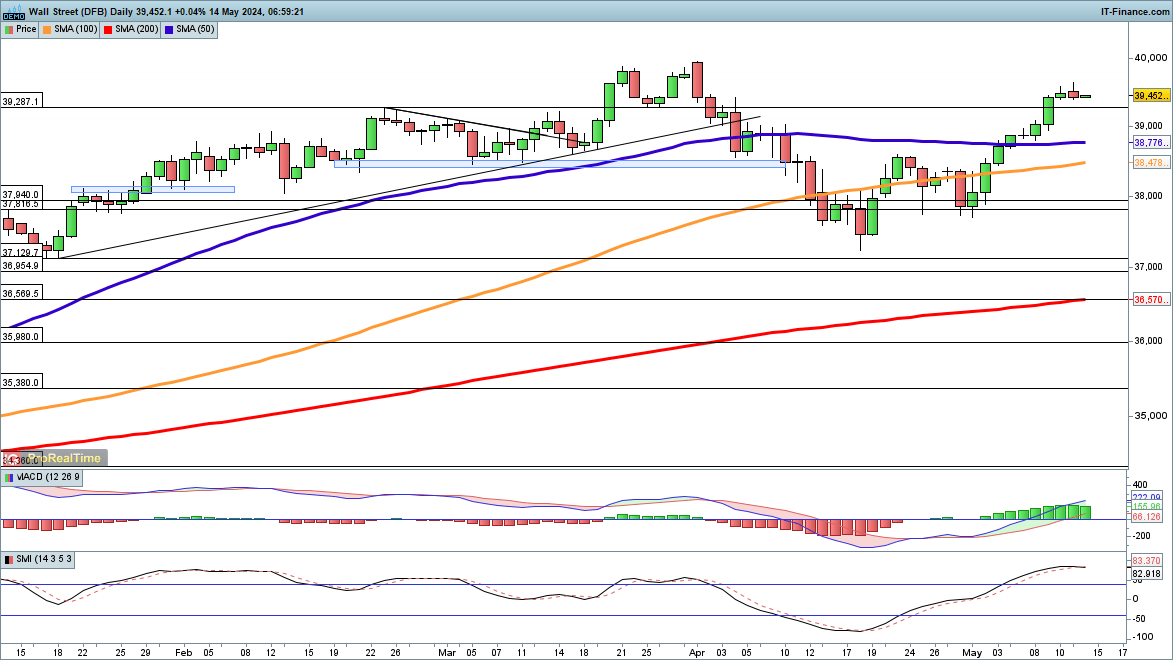
Source: ProRealTime, chart prepared by Chris Beauchamp
Nasdaq 100 on its Way to New Highs?
After a very solid rally over the past month, the index is slowing as it awaits the latest US inflation data.
Like the Dow, the index is now only a short-distance from the record highs of early March.Beyond this will see new record highs created.
Trendline support from the April low is to be found towards 17,600, so a close below this line and below 17,500 would be needed to suggest another push back to the lows of April around 17,000 is developing.
Nasdaq 100 Daily Chart
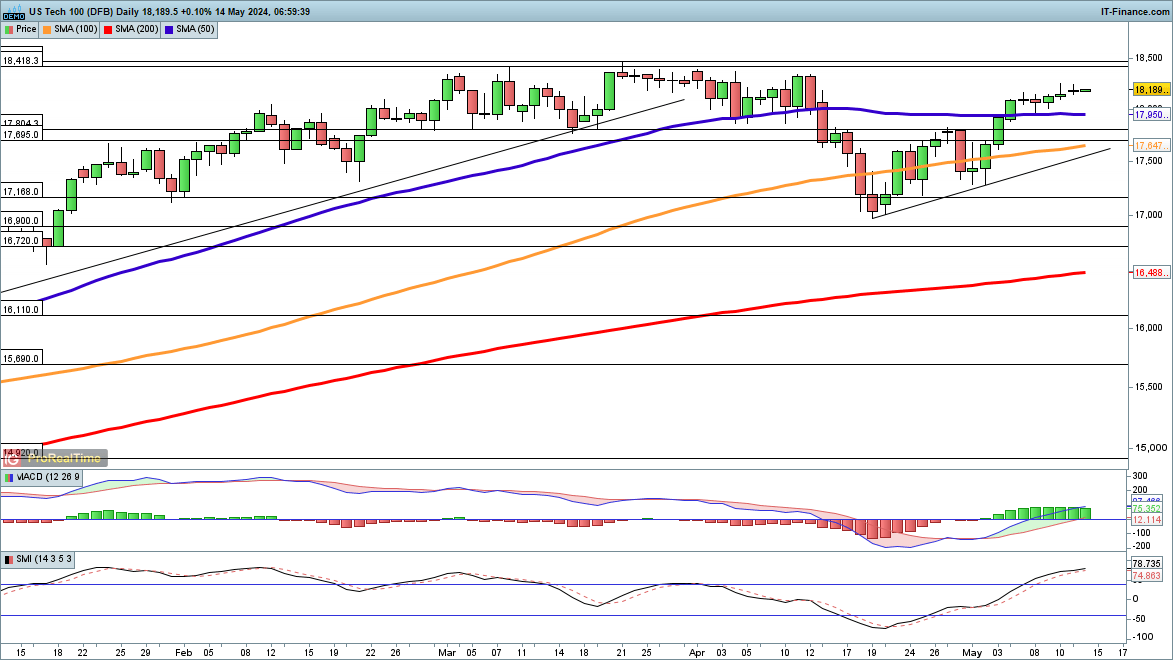
Source: ProRealTime, chart prepared by Chris Beauchamp
Hang Seng at nine-month high
This index continues to make impressive gains, moving above 19,000 once more on Monday.
This is the first close above 19,000 since August. The rally shows no sign of slowing down, with weakness last week rapidly finding fresh buyers.
In the medium-term, the July 2023 high of 20,370 beckons as the next level to watch on the upside, while a close back below 18,500 and then below of 18,175 would signal that a near-term retracement is beginning.
Hang Seng Daily Chart
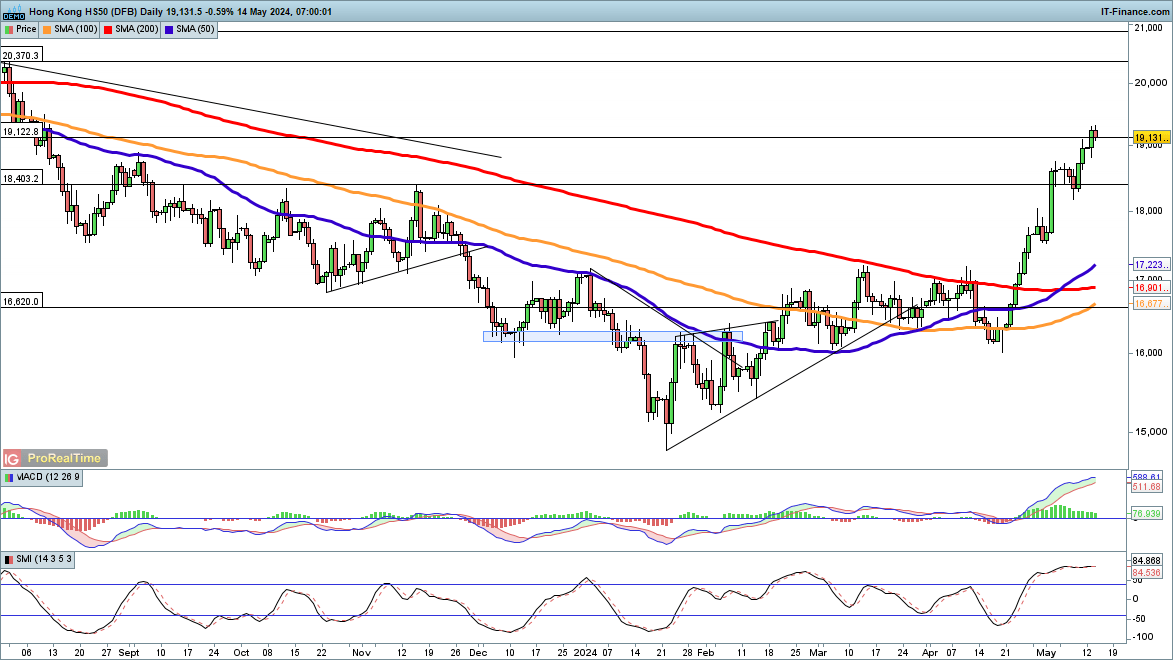
Source: ProRealTime, chart prepared by Chris Beauchamp
If you're puzzled by trading losses, why not take a step in the right direction? Download our guide, "Traits of Successful Traders," and gain valuable insights to steer clear of common pitfalls that can lead to costly errors.


