


Ripple Elliott Wave Talking Points:
- Ripple dips in a three wave pattern into minor support suggesting the dip is temporary
- The Elliott wave pattern for this cryptocurrency implies a bullish breakout may be on the horizon towards .77 and possibly .95
- An immediate move below .2550 would cause us to reconsider the current wave count
Ripple’s price has fallen nearly 40% in recent days. The price analysis for this cryptocurrency shows the potential for a longer term base forming. Using Elliott wave theory, it appears a bullish pattern may be in the process of carving towards .7500 so long as Ripple remains above .2550.
The current Elliott Wave for Ripple
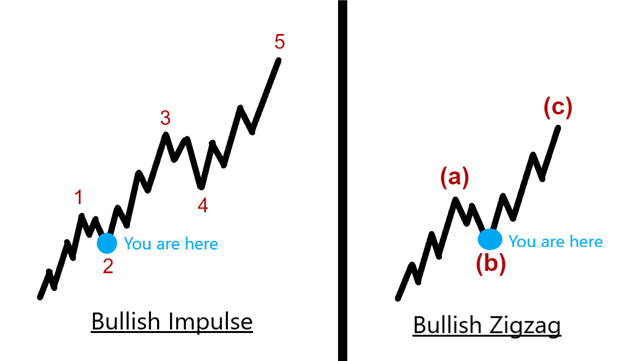
New to Elliott wave corrective patterns? On page 5 of our Elliott wave advanced guide, we explain Zigzag’s and where they commonly occur.
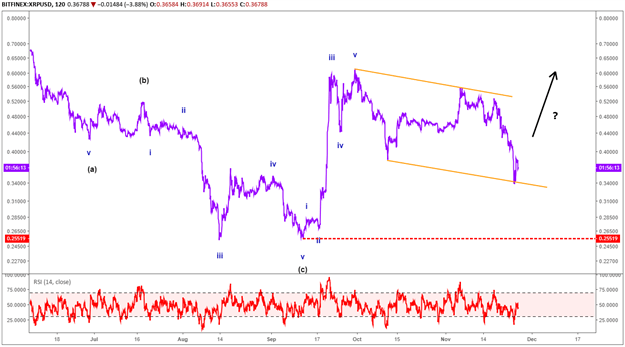
The Ripple chart shows a bullish impulse wave formed from September 12 to September 30. We know from our Elliott wave studies that when an impulse wave starts a new trend, then most times we witness a partial correction lower in three waves followed by another bullish motive wave of similar size or Fibonacci proportions to the original impulse wave. If this pattern continues to play out, then we look for Ripple to hold above .2550 and break above towards .7500. Therefore, the dip we saw last week appears to be some or all of wave 2 in a larger bullish impulse or wave B of a zigzag pattern.
Where is the key level?
The key level for the immediate bullish move is .2550 which is the impulse wave from mid-September. Once that September impulse wave terminated, it has corrected lower in a three wave pattern conforming to a corrective price channel. Therefore, we feel this correction is temporary before we see additional strength above the September high.
Elliott Wave FAQs
Can a newer trader learn and understand Elliott Wave Theory?
Just like learning to ride a bicycle, we all started as beginners at one time or another. I would first suggest familiarizing yourself with the Elliott wave terminology, and then read the Traits of Successful traders to understand the habits of successful traders. Therefore, regardless of the analytical method, you have a foundation for trading to build a strategy.
Interested in trading cryptocurrencies, but unsure about Elliott Wave Theory? Read our guide to day trading cryptocurrencies.
---Written by Jeremy Wagner, CEWA-M
Jeremy Wagner is a Certified Elliott Wave Analyst with a Master’s designation. These articles are designed to illustrate Elliott Wave applied to the current market environment. See Jeremy’s bio page for recent Elliott Wave articles to see Elliott Wave Theory in action.
Communicate with Jeremy and have your shout below by posting in the comments area. Feel free to include your Elliott Wave count as well.
Discuss this market with Jeremy in Monday’s US Opening Bell webinar.
Follow on twitter @JWagnerFXTrader
RECENT ELLIOTT WAVE ARTICLES
S&P 500 Pattern Warns of Weakness as Dollar Falters
NZDUSD Elliott Wave Analysis: Bullish Impulse Suggests More Upside


