


SP 500 continues a bearish sequence of patterns implying much lower levels. US Dollar appears to be entering a near term bearish Elliott wave cycle.
The video above is a recording of a US Opening Bell webinar from November 19, 2018. We focused on the Elliott Wave and patterns for key markets such as SP 500, NASDAQ, US Dollar Index, EURUSD, USDJPY, NZDUSD, Gold, and crude oil.
S&P 500 Elliott Wave Chart Points towards more weakness
In last week’s webinar, we wrote how SP 500 pattern hinted to new lows. The near term patterns continue to print in impulse waves lower followed by three wave corrective patterns higher. This is a bearish sequence and points to lower levels.

On the intraday chart above, last week’s low and high can be labeled as wave ‘i’ and ‘ii’ respectively. This places S&P 500 on the forefront of a large decline. So long as S&P 500 remains below the red trend line, we need to respect the potential for much lower levels. As described in the webinar recording, a move above the red trend line does not evict the large decline, but does begin to bring the bullish patterns back into scope.
One big reason we interpret this pattern to be a large decline is a result of the yellow-boxed area. It is difficult to consider the yellow-boxed area a bullish impulse wave. Therefore, the higher probability patterns are towards new lows.
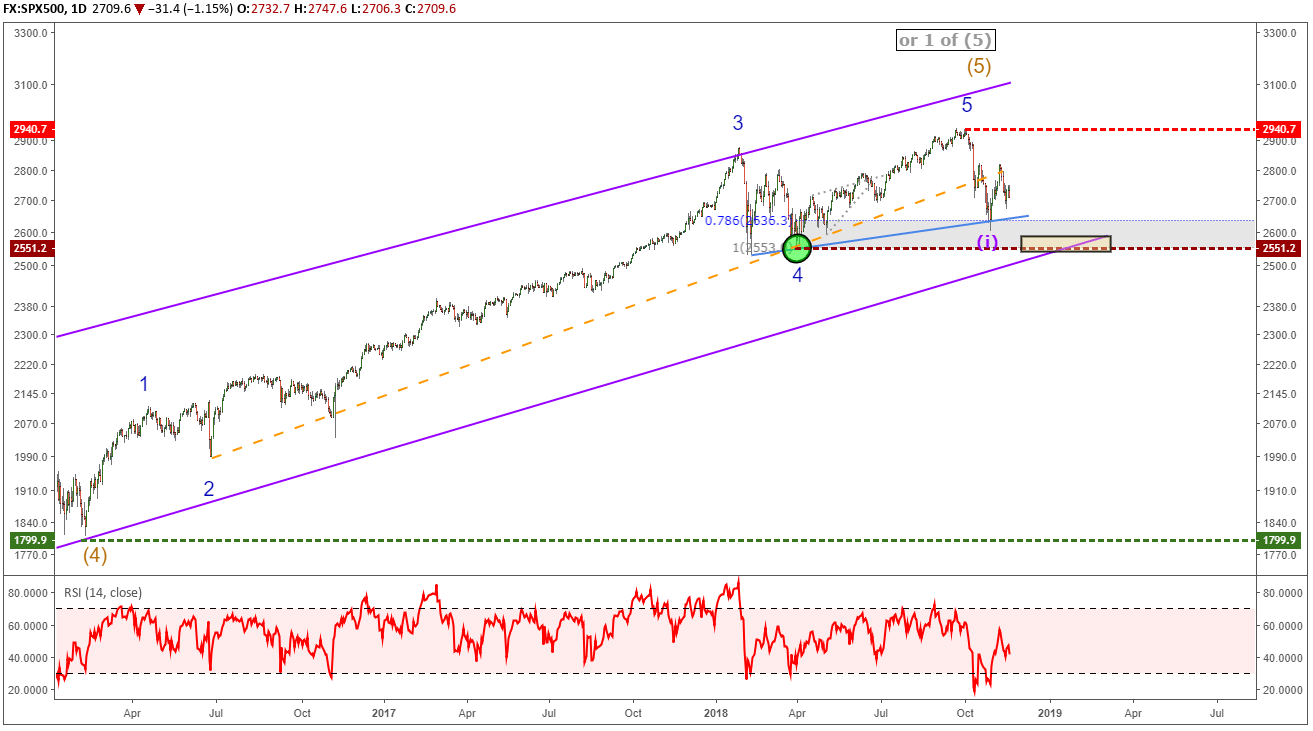
The October 29 low is important for the bullish patterns to emerge. A retest of this low at 2604 likely leads to an eventual break down below the critical 2551 mark. As shown on the chart above, a breakdown below 2551 elevates the extremely bearish counts even further and adds more evidence that the decade long advance is over and an important high is in place. The first target level to the downside on a break of 2551 includes the previous wave (4) low of 1800. A breakdown of that nature is likely ushered in with an increased in VIX and volatility levels.
Additional reading…
How to Trade S&P 500 Index: Strategies, Tips & Trading Hours
NASDAQ Is a little slower than S&P 500, but similar implications
Nasdaq 100 sports a similar pattern to S&P 500 above. That is to say the near term pattern appears to be unfolding as a wave 3 lower. This has deeply bearish implications. This bearish pattern needs to be respected so long as Nasdaq 100 remains below 7090 (not shown).
The daily chart below shows the longer-term implications should S&P 500 break down. If S&P 500 breaks 2551, then it implies an eventual break lower and move towards 3800 for Nasdaq 100.
Additional reading…
Nasdaq trading basics: how to trade Nasdaq 100

EURUSD Elliott Wave Chart Hints at Bull Run
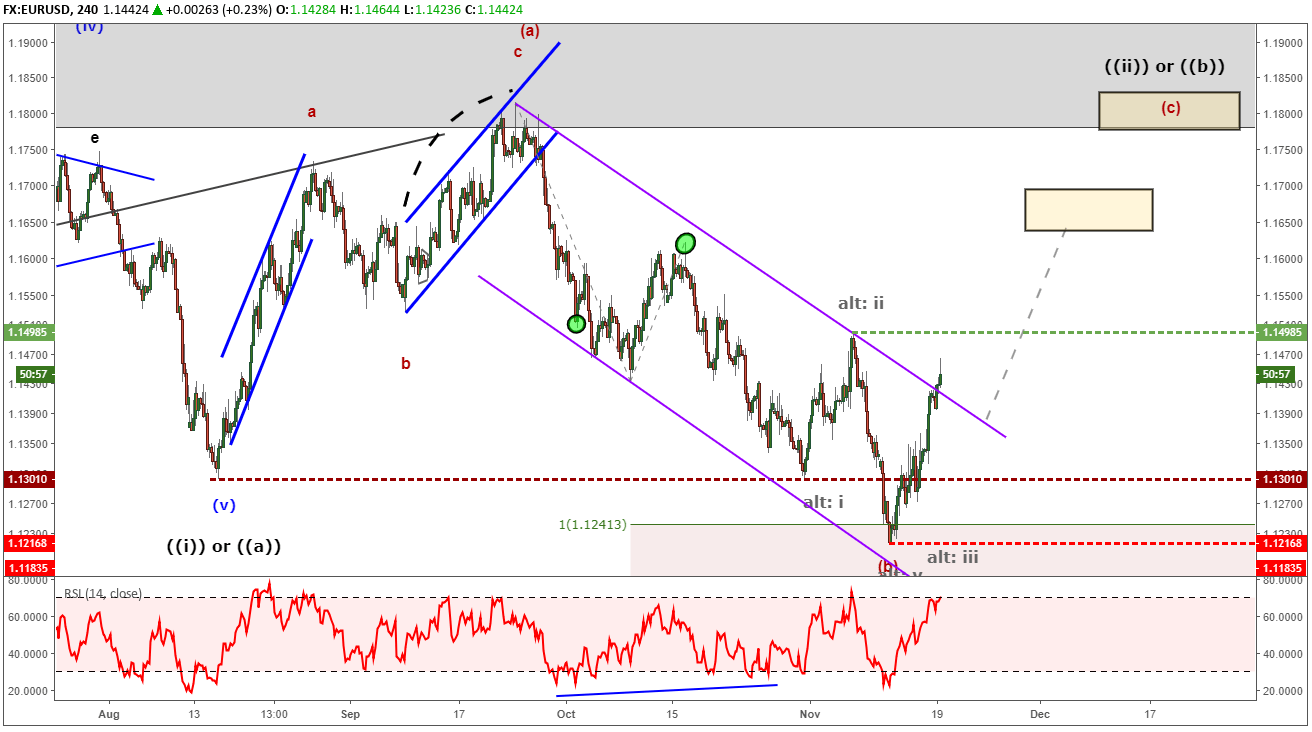
EURUSD has broken above the price channel created from the downtrend for the past two months. We have forecasted in the past how there are multiple scenarios placing a EURUSD dip lower as a temporary correction. The pop higher begins to build the case that a near term low is in place. A break above the November 7 high of 1.1500 will be an additional layer of confirmation that the trend is pointing higher.
It appears EUR/USD is bounding higher in wave (c). It is unknown at this time whether it is wave (c) of a running triangle or expanded flat pattern.
Either way, a rally to above 1.1650 is higher probability (in a triangle). If the pattern is a flat then strength may continue to 1.1800.
Live trader sentiment is shifting back towards the bears. Using sentiment as a contrarian signal, this implies more gains for EUR/USD too. Bottom line, there probabilities are high that EURUSD reaches 1.1650 while holding above 1.1217.
See and read about EURUSD’s live sentiment reading.
USD/JPY sells off as the 3 year triangle matures
USD/JPY has finally woken up and fallen as we have been forecasting a bearish turn while below 114.56. Though this drop may peel off a few hundred pips, since we are nearing the end of a three year triangle pattern we must keep an eye on longer term trend.
Though we anticipate USDJPY may drop below 111 to possibly 108, we believe we are in the final leg of a multi-year triangle. Therefore, this final leg may become truncated or possibly last longer than expected. Either way, we will look for signs of a bottom should USDJPY drop below 111.
Find out what we learned by studying millions of live trades in our Traits of Successful Traders research.

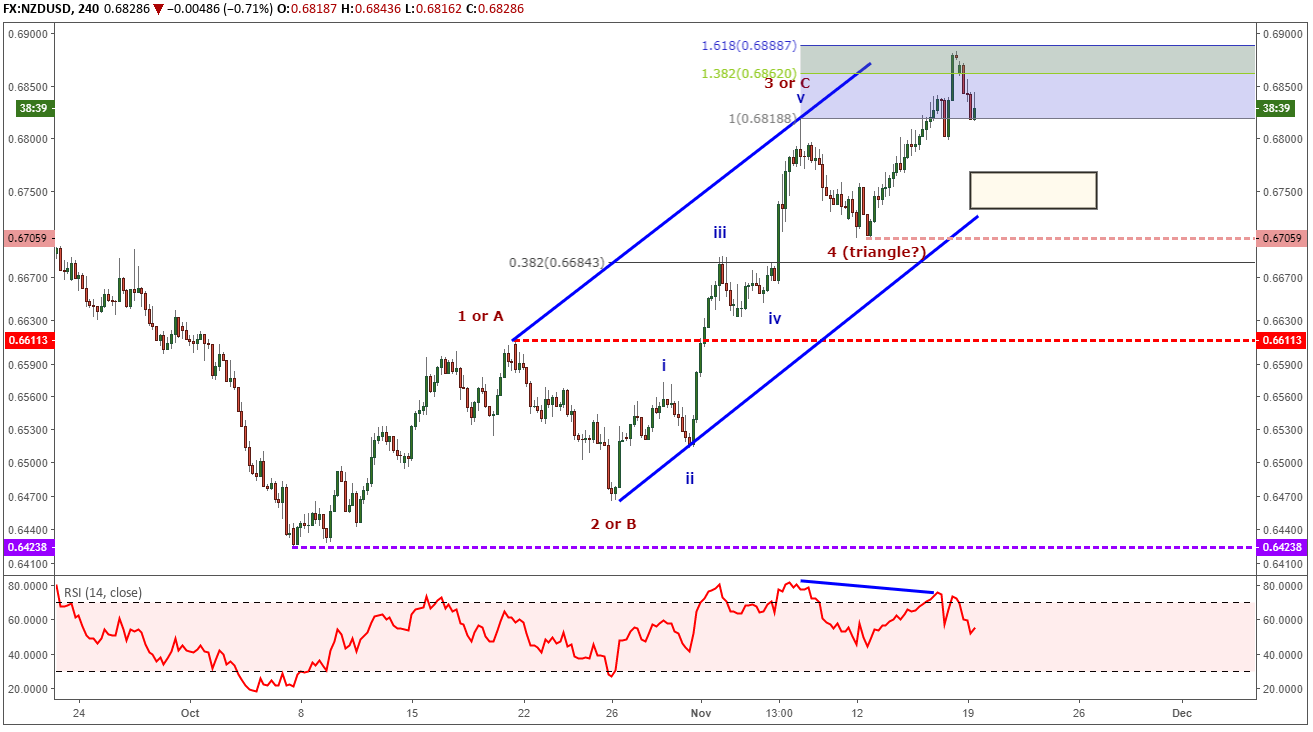
NZDUSD Elliott Wave Picture may be ahead of EURUSD
We wrote last week how the NZDUSD Elliott wave pattern was incomplete to the upside with greater bullish implications. Though NZD/USD broke above the proposed wave 3 high of .6819, we believe this is just part of wave 4. NZDUSD pricing may soften to around .6750 and we will look for wave 4 to terminate near there. A deeper set back may imply the five-wave bullish impulse wave is already in place, which then sets up a larger bullish opportunity from lower levels while holding above .6424.
Elliott Wave Theory FAQ
How does Elliott Wave theory work?
Elliott Wave theory is a trading study that identifies the highs and lows of price movements on charts via wave patterns. Traders analyze the waves for 5-wave moves and 3-wave corrections to determine where the market is at within the larger pattern. Additionally, the theory maintains three rules and several guidelines on the depth of the waves related to one another. Therefore, it is common to use Fibonacci with Elliott Wave analysis. We cover these topics in our beginners and advanced Elliott Wave trading guides.
After reviewing the guides above, be sure to follow future Elliott Wave articles to see Elliott Wave Theory in action.
---Written by Jeremy Wagner, CEWA-M
Jeremy Wagner is a Certified Elliott Wave Analyst with a Master’s designation. Jeremy provides Elliott Wave analysis on key markets as well as Elliott Wave educational resources. Read more of Jeremy’s Elliott Wave reports via his bio page.
Communicate with Jeremy and have your shout below by posting in the comments area. Feel free to include your Elliott Wave count as well.
Discuss these markets with Jeremy in Monday’s US Opening Bell webinar.
Follow me on Twitter at @JWagnerFXTrader .
H2 - Recent Elliott Wave analysis you might be interested in…
NZDUSD Elliott Wave Analysis: Bullish Impulse Suggests More Upside
GBPUSD Elliott Wave: Seeking Larger Impulse waves
USDJPY Elliott Wave: Trying for Higher Levels
EURUSD Elliott Wave Forecast Points Towards Temporary Correction


