


USDJPY Elliott Wave Talking Points:
- An Elliott wave zigzag from March 2018 has satisfied minimum expectations to finalize on October 4
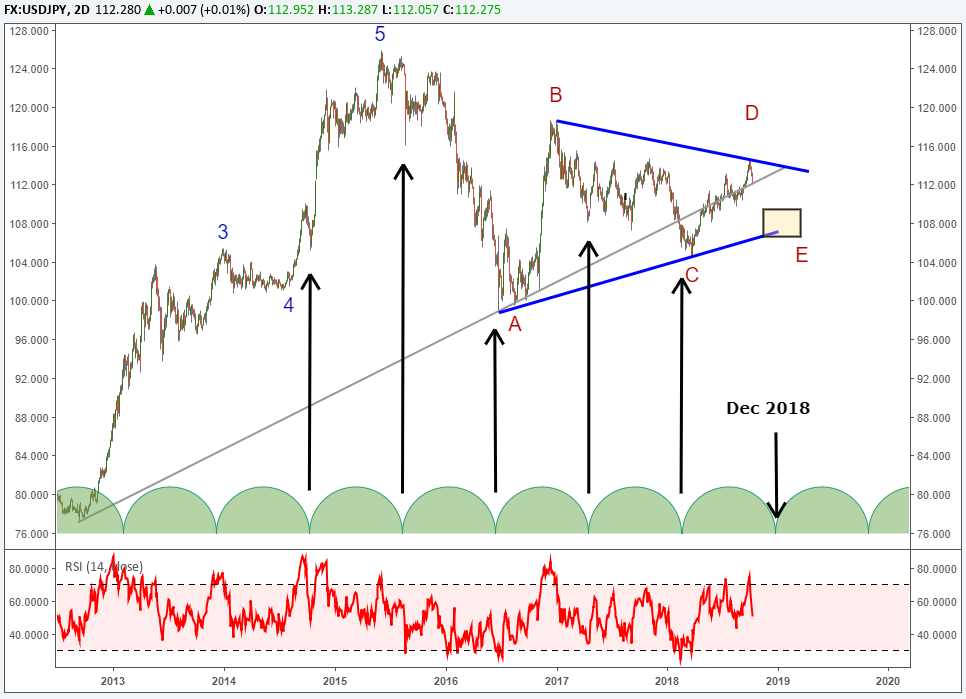
- This zigzag appears to have completed the ‘D’ leg of an A-B-C-D-E Elliott wave triangle
- A correction to 107-110 is higher probability
The sideways to choppy move higher in USDJPY over the past several months has been confusing to track in real time. That type of price action is typically indicative of a corrective wave. It is best to wait for clarity in levels before proceeding to trade them.
How does Elliott Wave Theory help us identify the reversal on USDJPY Chart?
The trend higher which began in March 2018 appears as a clear zigzag pattern labeled ((a))-((b))-((c)) where ((b)) is a triangle pattern. We are confident this is the higher probability pattern as the May to July 2018 wave terminated within the 1.618 level (purple arrow). This is a common bound for the second wave of a triangle. Once wave ((b)) finished, USDJPY jumped quickly to new highs, which is another common characteristic of post-triangle behavior.

The jump higher out of the triangle is labeled wave ((c)) and traveled to .618 times the length of wave ((a))…this is a common wave relationship between alternating waves in a zigzag.
Elliott Wave Forecast for USDJPY
As a result, we have several wave relationships illustrating the zigzag that began in March is finished. This zigzag could be counted as wave ‘D’ of a larger Elliott wave triangle that began from the 2015 high. Therefore, we anticipate wave ‘E’ to fall below 110 and possibly towards 107. For the triangle pattern to remain valid, wave ‘E’ would need to terminate above the March 2018 low of 104.63.
Timing Cycles Point towards December 2018
An interesting observation from a longer-term chart is that USDJPY appears to be respecting a 10-month cycle. In the chart below, we can see how approximately every 10 months since 2014, USDJPY establishes a tradeable low. Timing cycles are tricky and will phase in and out of favor without any notice. Once they become obvious use that as a warning of the cycle about to phase out.
In this case, as the waves hint towards downward price action for this final leg of a three-year triangle, we will be watching closely for an important bottom to form in the coming months. Perhaps December 2018 is that period…only time will tell but we will give priority to the Elliott wave structure and price action.
Elliott Wave FAQs
What is Elliott Wave Theory?
Elliott Wave Theory was developed by Ralph Nelson Elliott back in the 1930’s. It is a study of wave cycles and patterns. Five waves define the direction of the trend and three waves define a corrective move. Review our beginners and advanced Elliott Wave guides to learn more about the terms, rules, and common patterns of Elliott Wave principle.
After reviewing the guides, be sure to follow future Elliott Wave articles to see Elliott Wave Theory in action.
Can a newer trader learn and understand Elliott Wave Theory?
Just like learning to ride a bicycle, we all started as beginners at one time or another. I would first suggest familiarizing yourself with FX terminology and how to read a currency quote, and then read the Traits of Successful traders to understand the habits of successful traders. Therefore, regardless of the analytical method, you have a foundation for trading to build a strategy.
---Written by Jeremy Wagner, CEWA-M
Jeremy Wagner is a Certified Elliott Wave Analyst with a Master’s designation. These articles are designed to illustrate Elliott Wave applied to the current market environment. See Jeremy’s bio page for recent Elliott Wave articles.
Communicate with Jeremy and have your shout below by posting in the comments area. Feel free to include your Elliott Wave count as well.
Discuss this market with Jeremy in Monday’s US Opening Bell webinar.
Follow on twitter @JWagnerFXTrader .


