
If you're looking for a broader perspective on U.S. equity indices, make sure to download our Q2 stock market trading guide. It's your gateway to a wealth of ideas and indispensable insights.

Most Read: British Pound Down But Paring Losses Vs Dollar As Market Looks to Fed
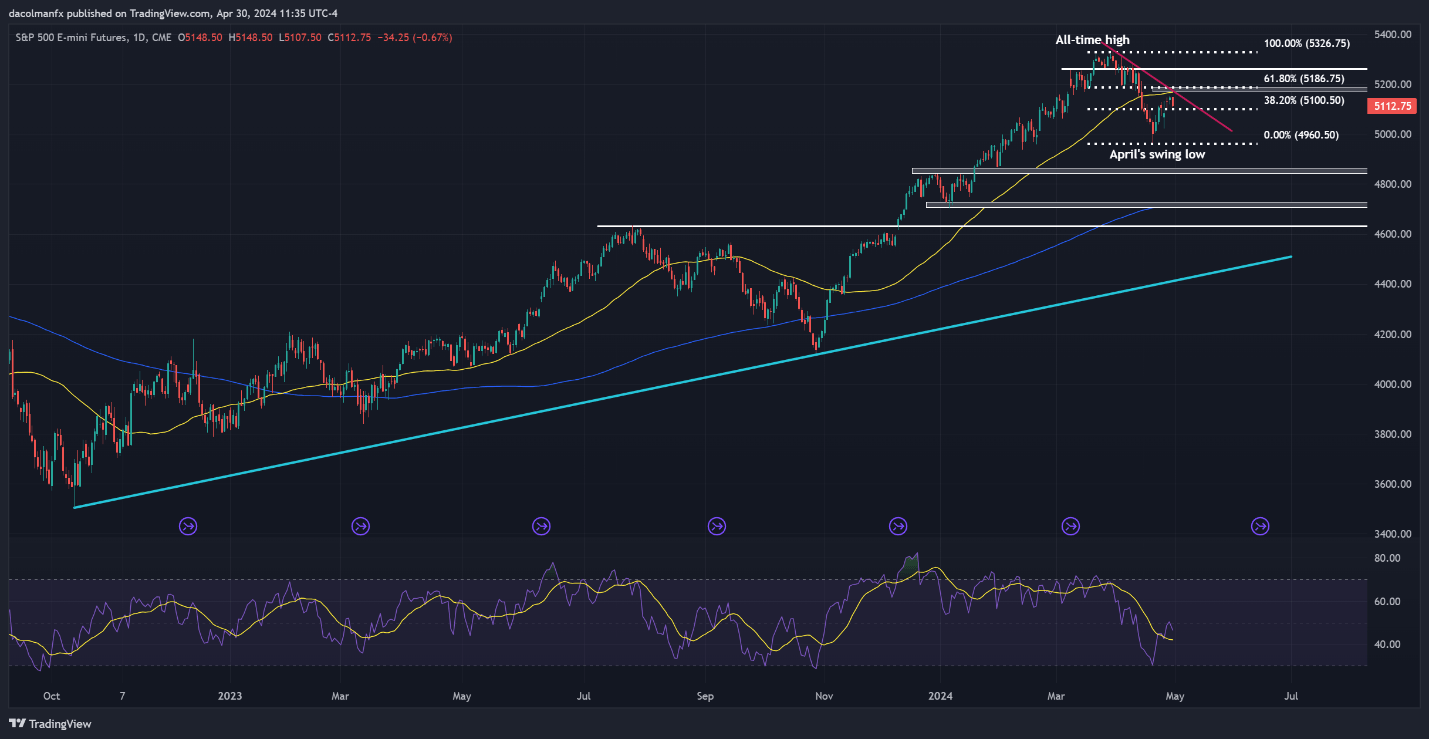
Following a robust start to the year, the S&P 500 experienced a significant downturn throughout the first three weeks of April. Finding support near 4,960, the index has seen a modest rebound in recent days. However, this upward movement may encounter a strong ceiling near the 5,165/5,185 range. This zone presents several technical obstacles, including the 50-day simple moving average (SMA), a short-term descending trendline, and the 61.8% Fibonacci retracement level from April's decline.
Given the S&P 500's proximity to confluence resistance, short positions in the index look compelling. Rising inflation risks and expectations that the Federal Reserve will have no choice but to keep interest rates higher for longer to achieve price stability reinforce the bearish outlook for risk assets in the near term, at least from a fundamental standpoint.
If the bearish reversal scenario plays out and prices are rejected at the 5,165/5,185 resistance, a pullback towards April's swing low could be on the horizon. While a retest of this region might offer temporary support, a decisive breakdown would signal a potential extension toward 4,855. Further losses from this point onward would shift focus to the 200-day simple moving average near 4,725.
Despite a seemingly strong bearish thesis, traders should exercise caution and avoid fighting against prevailing price action. On that note, if the S&P 500 remains on a recovery path and pushes past the 5,165/5,185 ceiling convincingly on a daily closing basis, the short strategy would lose its validity. Such a breakout could reignite bullish sentiment, opening the path toward 5,260, with the possibility of revisiting the record high also in the cards.
To get an edge in your trading and understand how market positioning may affect the S&P 500’s path, download a copy of our sentiment guide!
| Change in | Longs | Shorts | OI |
| Daily | 1% | -1% | 0% |
| Weekly | 15% | -13% | -1% |
S&P 500 TECHNICAL CHART