


The Elliott wave forecast for EURUSD suggests that the current bear trend from September is temporary and a bullish wave may begin soon. Below we inspect three different Elliott Wave counts and their characteristics.
The higher probability Elliott wave count we are following is that wave b of an expanded flat or running triangle is mature. Both patterns imply similar outcomes in that a bullish reversal may begin soon, though the shape of the patterns are slightly different.
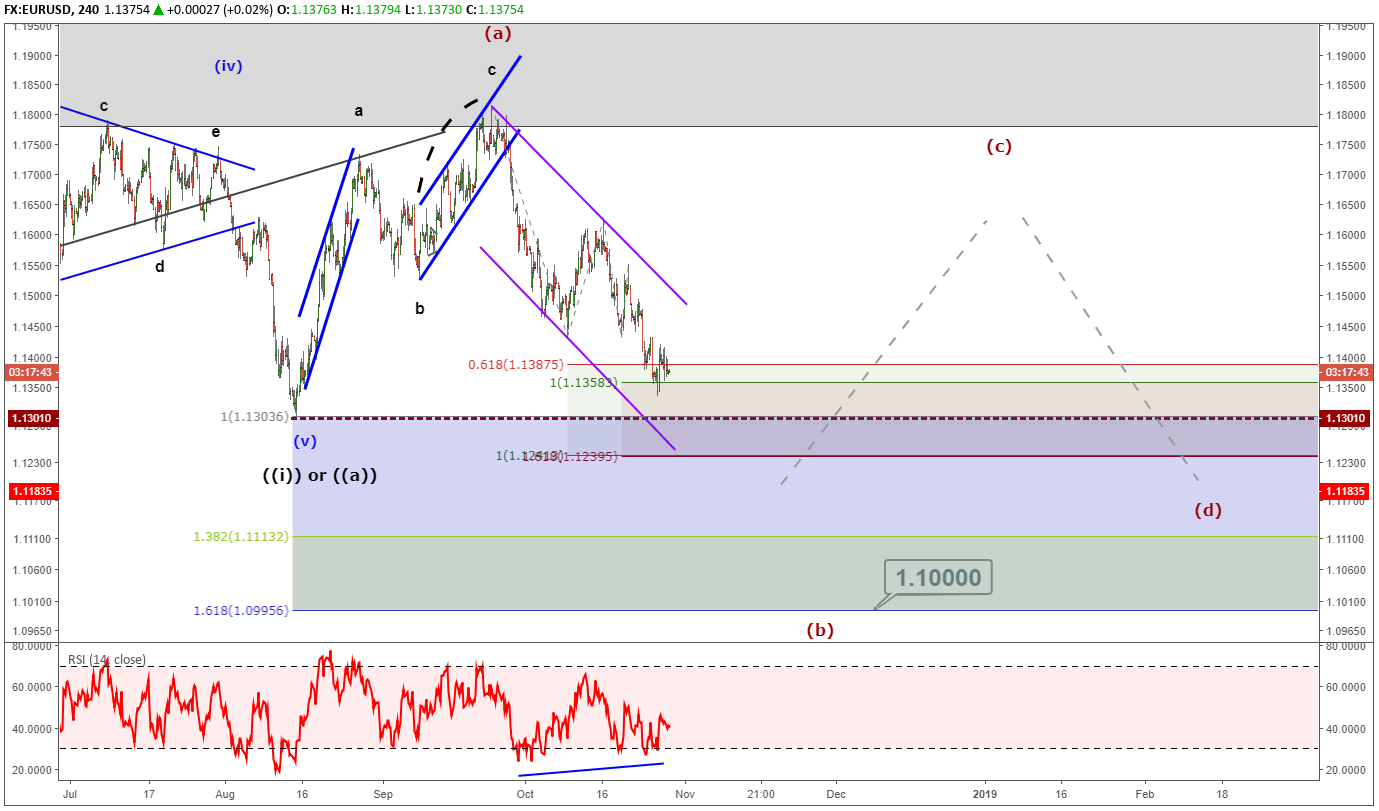
Bullish EURUSD in wave c of an Elliott Wave flat
An Elliott wave flat pattern is a 3-wave pattern labeled a-b-c. I believe we are towards the end of the ‘b’ wave and the bullish ‘c’ wave may begin soon. We know from our Elliott wave studies that the ‘b’ wave of a flat pattern will subdivide as a three wave move or complex correction. ‘B’ waves are typically 80-138% the length of the ‘a’ wave so this current correction lower can drift to 1.1113 and still be within the context of the flat pattern.
If support emerges, look for an impulse wave or diagonal wave to develop for a retest of the 1.18 high.
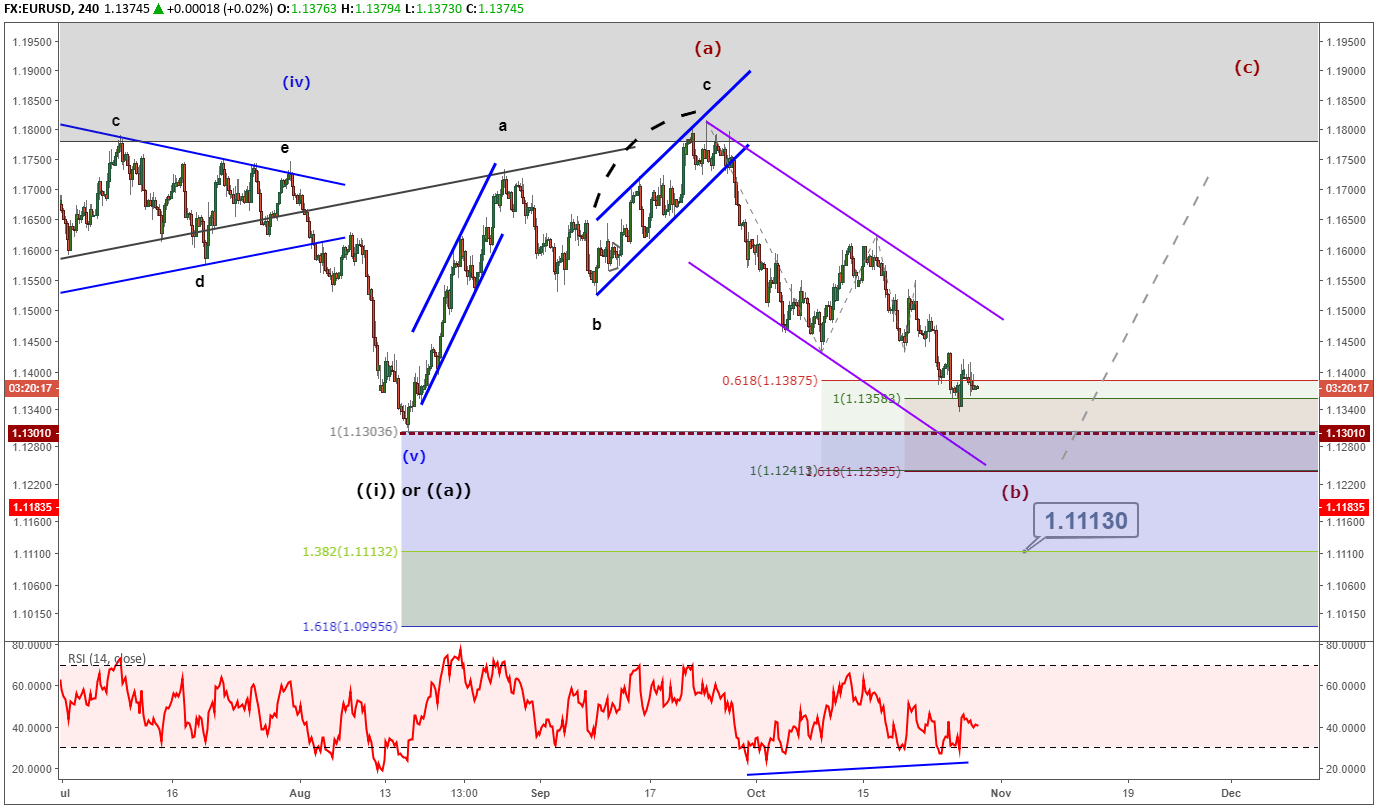
Bullish EURUSD in wave c of an Elliott Wave triangle
If EURUSD is carving out an Elliott wave triangle that began August 15, 2018, then look for a bullish wave to begin from above 1.1000. I realize this is a big range to deal with but that is the challenge of the market at this juncture. It is difficult to establish a higher probability trade with good risk to reward ratio prospects. This bullish wave likely will not be as strong as the ‘c’ wave of a flat pattern. Therefore, if EURUSD trickles higher it could be symptomatic of the triangle taking shape.
Elliott wave triangles contain at least five waves [labeled (a)-(b)-(c)-(d)-(e)] with converging end points giving it the triangle look. This pattern likely requires more time to develop and may carry out into the rest of 2018.
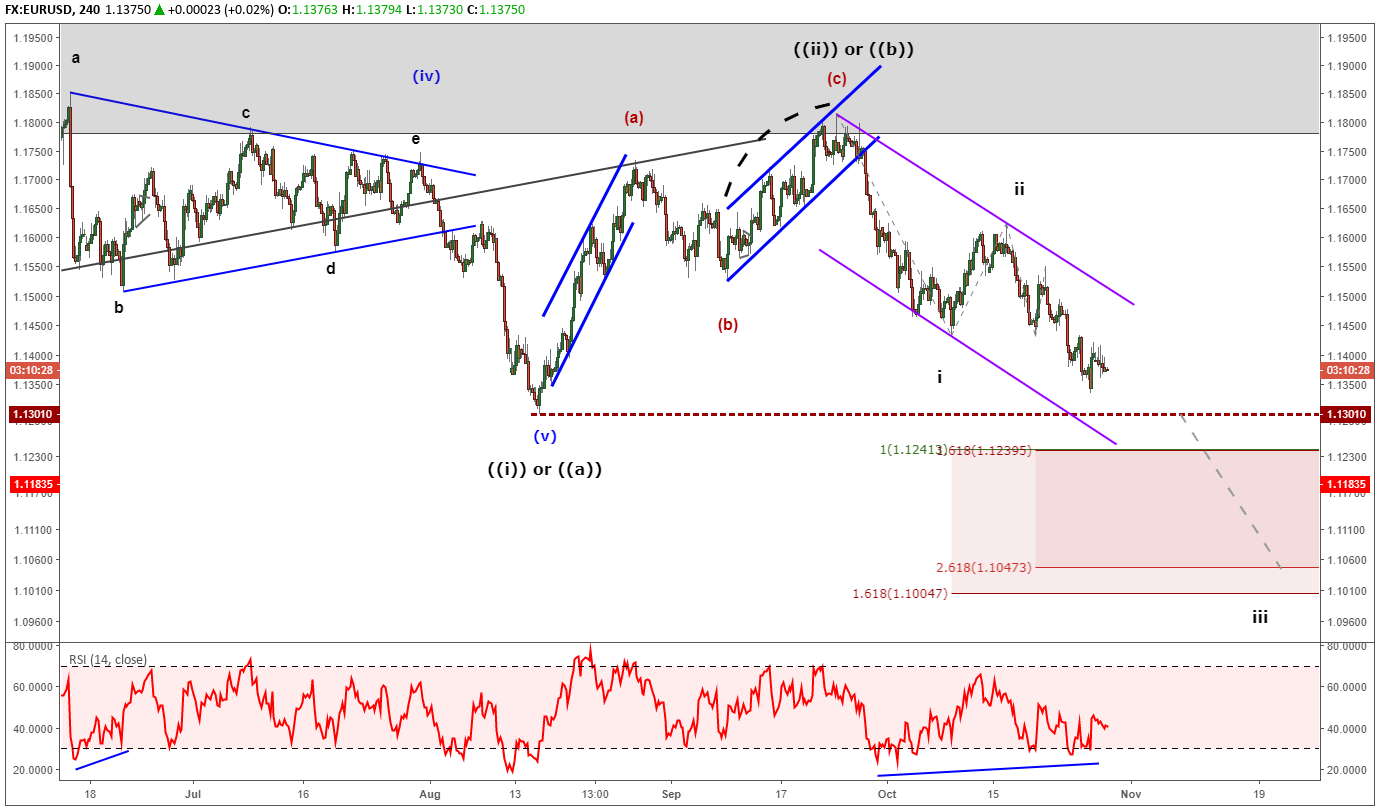
Bearish EURUSD in a continuation of the February 2018 down trend
If EURUSD continues to crumble, the strongly bearish wave count is that the bearish trend which began February 2018 is resuming to the downside. We believe this to be a lower probability wave count because the bear trend that began in September does not take on an impulsive look. However, if EURUSD were to gather itself and morph into an impulse wave to the downside, then we may see targets near 1.10 and 1.06.
Learn more about common Elliott wave patterns by reviewing the beginners and advanced Elliott wave guides.
---Written by Jeremy Wagner, CEWA-M
Jeremy Wagner is a Certified Elliot Wave Analyst with a Master’s designation. Jeremy provides Elliot wave analysis on key markets as well as Elliott wave education resources. Read more of Jeremy’s Elliott wave reports via his bio page.
Communicate with Jeremy and have your shout below by posting in the comments area. Feel free to include your Elliot wave count as well.
Discuss these markets with Jeremy in Monday’s US Opening Bell webinar.
Follow Jeremy on twitter at @JWagnerFXTrader .


