


EURUSD breaks to new 16 months lows after a sharp reversal on November 7. Meanwhile, the late Friday correction in SP 500 has continued forward to today and points to lower levels.
The video above is a recording of a US Opening Bell webinar from November 12, 2018. We focused on the Elliott Wave and patterns for key markets such as SP 500, Dow Jones, NASDAQ, US Dollar Index, EURUSD, USDJPY, GBPUSD, and NZDUSD.
EURUSD Elliott Wave Chart at 16 Month Lows
EURUSD has broken through support, which has excited the bears. The number of traders positioned to the long side is lower now than when EURUSD bottomed on October 31. Meanwhile, the number of bearish traders has increased over this same period. Taken together, the sentiment reading has fallen from +2.07 to the current reading of +1.83. Sentiment is a contrarian tool and suggests this downtrend may be a temporary move.
The Elliott wave count can place multiple scenarios such that this EURUSD dip lower is a temporary correction and possibly a ‘B’ wave. EURUSD has just reached a level near 1.1240 where the down move since October 16 is equal in length to the September 24 to October 9 down wave. It is possible EURUSD may pause near here but it does not have to. ‘B’ waves are tough ones to trade so wait for resistance to get taken out prior to wading into the bullish waters.
See and read about EURUSD’s live sentiment reading.

US Dollar Index Elliott Wave Chart shows a bear run back towards 94
Opposite of EURUSD, we have US Dollar Index (DXY). DXY pivoted higher when tagging the upward sloping trend channel. This market can continue higher and still be considered within a ‘B’ wave. There are multiple wave relationships coming into play near 98. Therefore, if Dollar Index does not respect this 98 zone, then we will reconsider the more bullish Elliott wave counts.
If the current ‘B’ wave scenario plays out, then DXY may dip back towards the September low near 94. An abbreviated correction that makes it only to around 95 may tip off that an Elliott wave triangle scenario is playing out.

GBPUSD Elliott Wave Picture is a Little Cleaner Than EURUSD
GBPUSD typically moves in similar wave patterns as EURUSD. The recent GBPUSD waves appears to be in stronger one way trending moves. Therefore, it may be worthwhile for us to take some clues as to the dollar’s movement by gauging GBPUSD and if larger impulse waves develop.
It appears as though Cable may have continued weakness is the medium term and a shorter term rally to relieve that oversold pressure would be considered normal. A move below 1.2694 suspends this view.

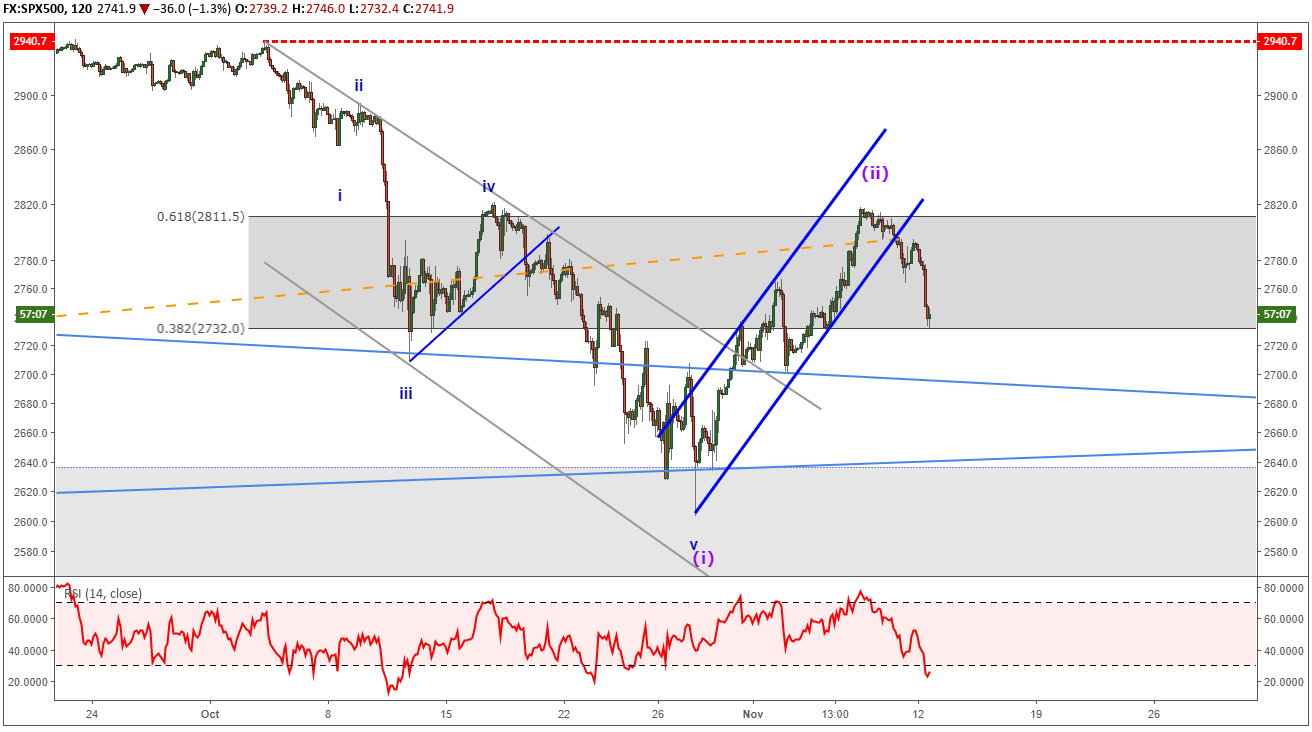
SP 500 Elliott Wave Consolidates Implying additional weakness
In last week’s webinar, we highlighted how lows near the Friday October 26 low in SP 500 were important. This is due to it forming near the 78.6% retracement level of the April 2, 2018 up trend. On November 9, SP 500 broke down outside of the upward sloping price channel that had been supporting it all week. This breakdown warns of further losses to revisit last week’s low. In doing so, the entire uptrend is at risk as we highlighted the importance of the 2550 level. A break down below 2550 has larger loss implications for SP 500.
Additional reading…
How to Trade S&P 500 Index: Strategies, Tips & Trading Hours
Elliott Wave Theory FAQ
How does Elliott Wave theory work?
Elliott Wave theory is a trading study that identifies the highs and lows of price movements on charts via wave patterns. Traders analyze the waves for 5-wave moves and 3-wave corrections to determine where the market is at within the larger pattern. Additionally, the theory maintains three rules and several guidelines on the depth of the waves related to one another. Therefore, it is common to use Fibonacci with Elliott Wave analysis. We cover these topics in our beginners and advanced Elliott Wave trading guides.
After reviewing the guides above, be sure to follow future Elliott Wave articles to see Elliott Wave Theory in action.
---Written by Jeremy Wagner, CEWA-M
Jeremy Wagner is a Certified Elliott Wave Analyst with a Master’s designation. Jeremy provides Elliott Wave analysis on key markets as well as Elliott Wave educational resources. Read more of Jeremy’s Elliott Wave reports via his bio page.
Communicate with Jeremy and have your shout below by posting in the comments area. Feel free to include your Elliott Wave count as well.
Discuss these markets with Jeremy in Monday’s US Opening Bell webinar.
Follow me on Twitter at @JWagnerFXTrader .
Recent Elliott Wave analysis you might be interested in…
GBPUSD Elliott Wave: Seeking Larger Impulse waves
USDJPY Elliott Wave: Trying for Higher Levels
EURUSD Elliott Wave Forecast Points Towards Temporary Correction


