


The pivot towards US Dollar weakness late last week suggests that trend may continue in the near term pushing EURUSD higher. US equities like SP 500 have bounced to keep the bullish trends alive, though they are severely hampered.
The video above is a recording of a US Opening Bell webinar from November 5, 2018. We focused on the Elliott Wave and patterns for key markets such as US Dollar Index, EURUSD, USDJPY, SP 500, Dow Jones, NASDAQ, and Oil.
US Dollar Index Elliott Wave Chart shows a bear run back towards 94
US Dollar Index (DXY) pivoted last week near the highs from August. As the September to October up trend was in three waves, we are counting this as a (b) wave of a larger Elliott wave corrective pattern...possibly a flat or triangle.
Under the flat or triangle scenario, DXY may continue to dip this week towards the September low near 94. An abbreviated correction that makes it only to around 95 may tip off that an Elliott wave triangle scenario is playing out.

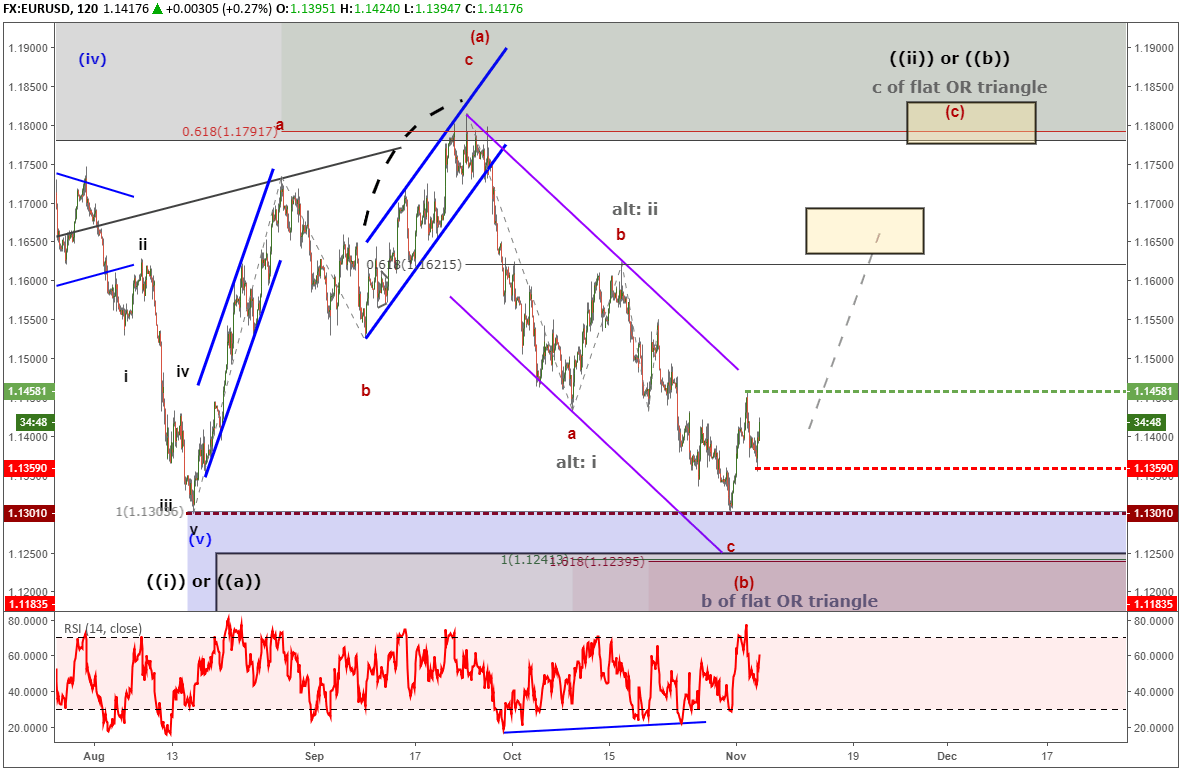
EURUSD Elliott Wave Count Points towards 1.18
Last week, we wrote how the EURUSD Elliott wave forecast points towards a temporary correction. Well, the move lower stopped a day later on October 31. EURUSD has not risen far enough to confirm a near term bottom is in place, though the rise is taking the shape of a bullish Elliott wave 5-3 pattern.
We cannot identify with certainty if the rise of the proposed (c) wave is part of a flat or triangle pattern. Both patterns imply a similar outcome in that after a move higher, EURUSD is likely to test 1.13 again.
A break above last week’s high in EURUSD will offer more confirmation of a bullish move. Intraday traders may consider that to be a tradeable opportunity. A move below 1.1359 suspends the bullish forecast.
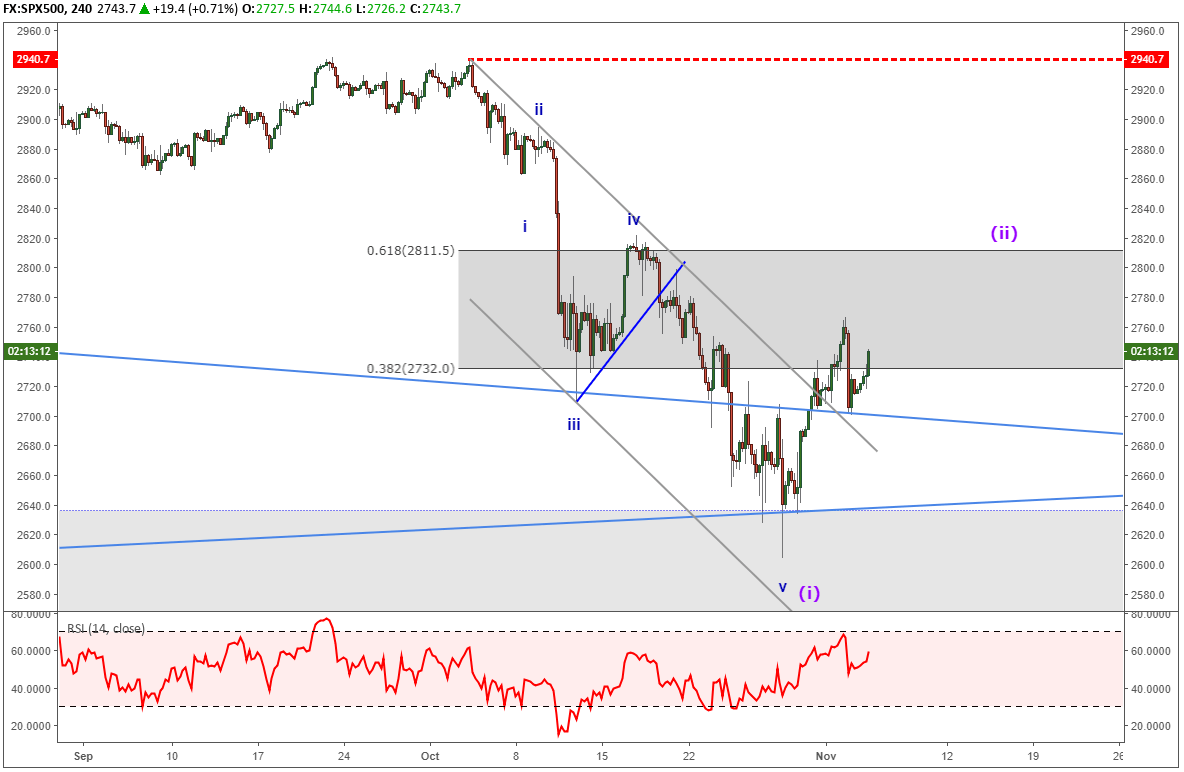
SP 500 Elliott Wave Consolidates Implying additional weakness
In last week’s webinar, we highlighted how the Friday October 26 low in SP 500 was an important low. This is due to it forming near the 78.6% retracement level of the April 2, 2018 up trend. The April 2, 2018 low in SP 500 is important to the 9 year up trend for SP 500.
Though SP 500 did come back on last Monday with another temporary break, prices have aggressively rallied. The bullish pattern is still alive but hanging by a thread. That is to say, last week’s low was wave ii of 5. A break above 2941 confirms this wave count.
However, the bearish wave picture is still valid too. The bearish Elliott wave count is that last week’s low was wave (i) of a new bear trend and the current rally is wave (ii). This would imply a partial retracement higher that holds below 2941 on route to a break down below 2550 and possibly to 1800. As we have outlined in the past webinars, this is a very bearish pattern to which 2550 is the critical level for bulls.
Additional reading…
How to Trade S&P 500 Index: Strategies, Tips & Trading Hours
Elliott Wave Theory FAQ
How does Elliott Wave theory work?
Elliott Wave theory is a trading study that identifies the highs and lows of price movements on charts via wave patterns. Traders analyze the waves for 5-wave moves and 3-wave corrections to determine where the market is at within the larger pattern. Additionally, the theory maintains three rules and several guidelines on the depth of the waves related to one another. Therefore, it is common to use Fibonacci with Elliott Wave analysis. We cover these topics in our beginners and advanced Elliott Wave trading guides.
After reviewing the guides above, be sure to follow future Elliott Wave articles to see Elliott Wave Theory in action.
---Written by Jeremy Wagner, CEWA-M
Jeremy Wagner is a Certified Elliott Wave Analyst with a Master’s designation. Jeremy provides Elliott Wave analysis on key markets as well as Elliott Wave educational resources. Read more of Jeremy’s Elliott Wave reports via his bio page.
Communicate with Jeremy and have your shout below by posting in the comments area. Feel free to include your Elliott Wave count as well.
Discuss these markets with Jeremy in Monday’s US Opening Bell webinar.
Follow me on Twitter at @JWagnerFXTrader .


