


SP 500 rallied but still holds below recent resistance. Cryptocurrencies fall as they search for a base of support. The Elliott wave analysis has us searching for reversals.
The video above is a recording of a US Opening Bell webinar from December 3, 2018. We focused on the Elliott Wave and patterns for key markets such as SP 500, NASDAQ, DXY, EURUSD, USDJPY, NZDUSD, Ether, Ripple, Gold, crude oil, and Natural Gas.
S&P 500 Elliott Wave Chart Stuck in the Middle
In last week’s webinar, we noted wrote how S&P 500 pattern walks the ledge as it was possible a large correction may take place. If the sell off did not occur, that did not negate the potential for a deep contraction, but would delay it and elevate the potential for new highs.
Since then, S&P 500 has rallied but it has not broken any meaningful levels. The Elliott wave picture noted below is the bearish count. It implies a bearish reversal below 2941 for an eventual breakdown below 2551.
If S&P 500 breaks above 2941, then we will consider a bullish alternative that implies the market is rallying in wave ‘3’ of (5).

Additional reading…
How to Trade S&P 500 Index: Strategies, Tips & Trading Hours
NZDUSD Elliott Wave Picture Shows an incomplete advance
We wrote recently how the NZDUSD Elliott wave pattern was incomplete to the upside with greater bullish implications. It appears as though NZD/USD finished its wave 4 triangle on November 27. Therefore, that means NZD/USD is jumping higher in a fifth and final wave of the sequence that began on October 7.
Once this bullish impulse sequence exhausts, we are anticipating a partial set back while holding above .6423, likely to .6650-.6750. At that point, we will begin to seek out bullish opportunities on a further break above current highs.
The current Elliott wave count for NZDUSD appears to be wave v of 5 of (a).
Find out what we learned by studying millions of live trades in our Traits of Successful Traders research.

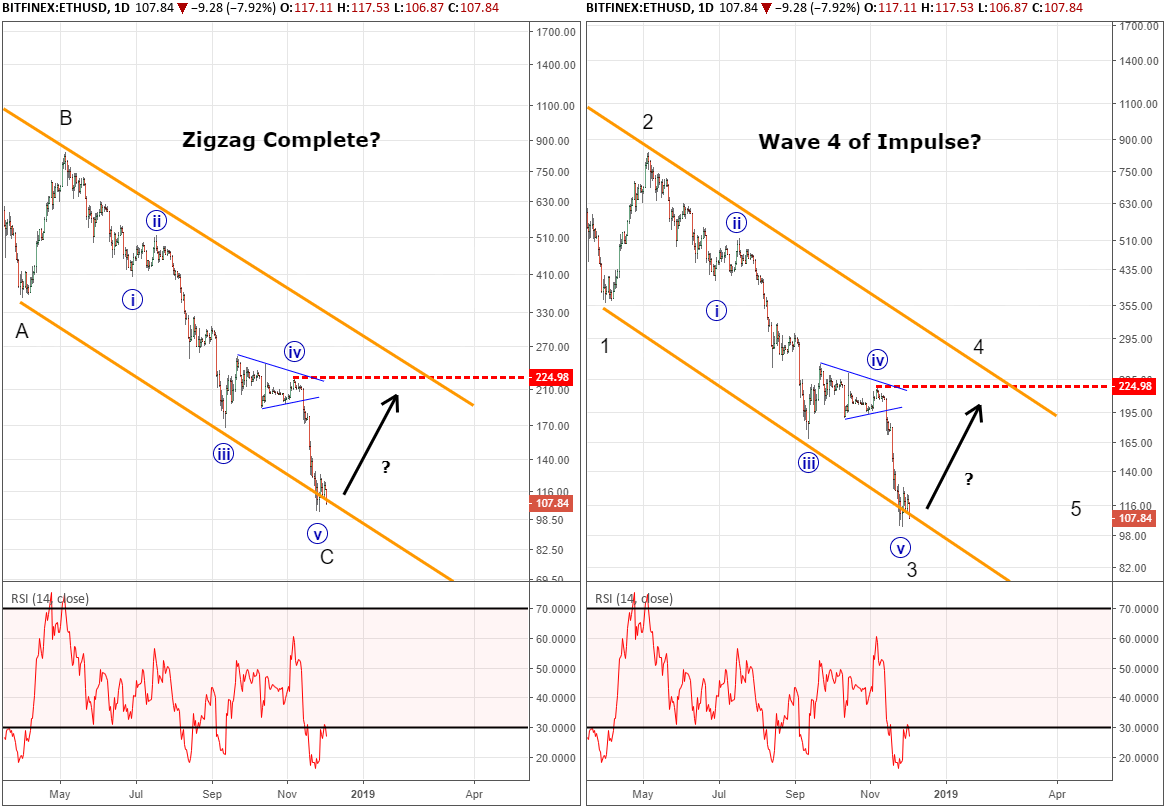
Ether chart searches for support to kick off a rally
From nearby levels, it appears as though Ether may try to form a base of support to initiate a rally. The two main wave counts we are favoring is a completed zigzag or wave three of a bearish impulse. Under both scenarios, Ether’s price is forecasted to see a large rally to develop that may drive up towards 225. Keep an eye on other cryptocurrencies and look for rallies in unison as confirmation.
Ripple Elliott Wave chart hold above recent lows at .25
Ripple’s chart shows an impressive rally from the September low. Since then, it has corrected lower in three waves as we look for a bullish base to build. This 5-3 pattern is bullish overall as we focus towards higher levels. However, Ripple (XRP) has rallied in three wave from the recent November 25 low. This implies one last dip to below .3290 may be on the horizon to finish off the larger corrective pattern.
Consider the bullish forecast for Ripple prices so long as it remains above .2550.

Elliott Wave Theory FAQ
How does Elliott Wave theory work?
Elliott Wave theory is a trading study that identifies the highs and lows of price movements on charts via wave patterns. Traders analyze the waves for 5-wave moves and 3-wave corrections to determine where the market is at within the larger pattern. Additionally, the theory maintains three rules and several guidelines on the depth of the waves related to one another. Therefore, it is common to use Fibonacci with Elliott Wave analysis. We cover these topics in our beginners and advanced Elliott Wave trading guides.
After reviewing the guides above, be sure to follow future Elliott Wave articles to see Elliott Wave Theory in action.
---Written by Jeremy Wagner, CEWA-M
Jeremy Wagner is a Certified Elliott Wave Analyst with a Master’s designation. Jeremy provides Elliott Wave analysis on key markets as well as Elliott Wave educational resources. Read more of Jeremy’s Elliott Wave reports via his bio page.
Communicate with Jeremy and have your shout below by posting in the comments area. Feel free to include your Elliott Wave count as well.
Discuss these markets with Jeremy in Monday’s US Opening Bell webinar.
Follow me on Twitter at @JWagnerFXTrader .
H2 - Recent Elliott Wave analysis you might be interested in…
Ethereum price forecasted to see large gain using Elliott wave analysis
Ripple Dips Into Support as Bullish Base Builds
NZDUSD Elliott Wave Analysis: Bullish Impulse Suggests More Upside


