


USD/ZAR price action talking points:
- Since January 31, USDZAR has been advancing in impulsive waves while correcting in three waves
- The pattern appears incomplete to the upside
- Target of 14.85 while holding above 13.80
USDZAR Elliott wave pattern appears incomplete for bulls
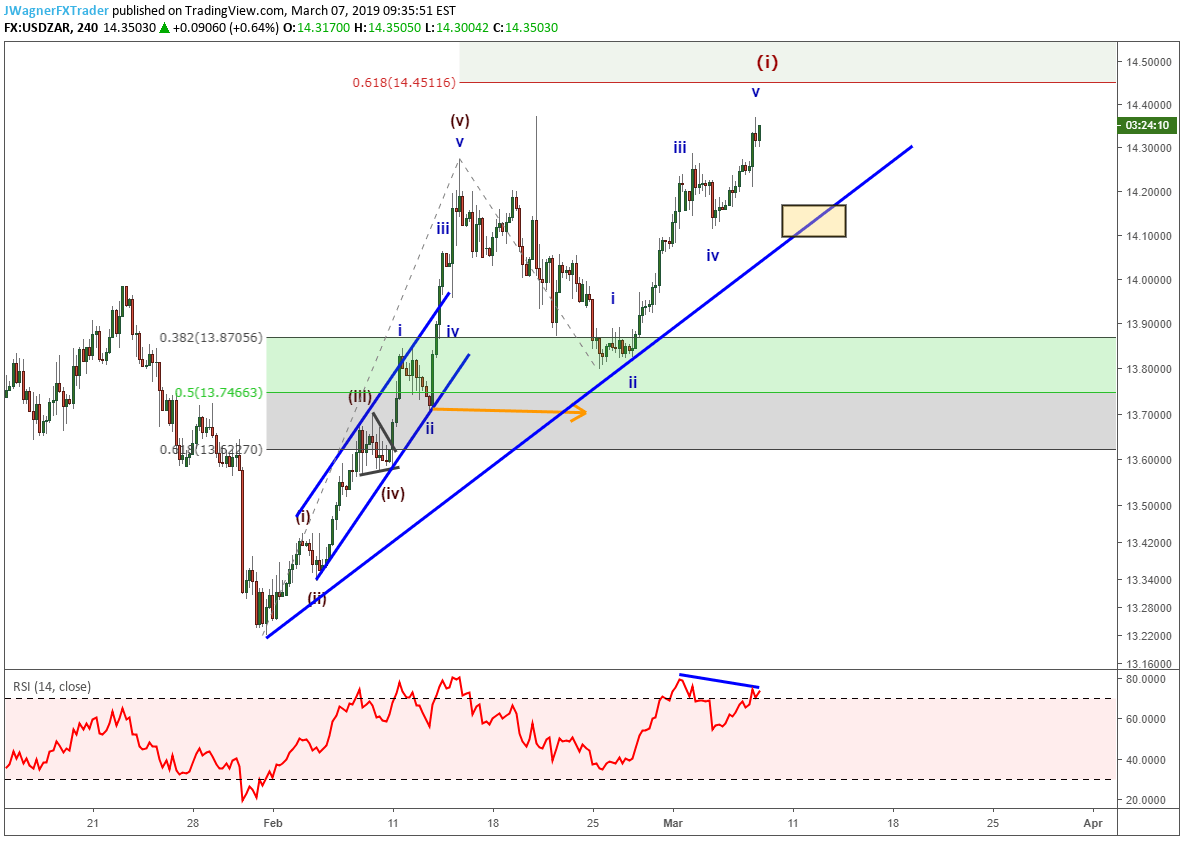
USDZAR has increased aggressively from the January 31 low. We can count this move as a bullish impulse wave with an extended fifth wave. After an impulse wave completes with an extended fifth wave, many times the correction walks back into the price territory for wave ii of (v). In the case of USD/ZAR, that price territory is from 13.70-13.85. After forming a bottom at 13.80 on February 25, USDZAR has resumed with another bullish impulse wave.
Now that the pattern of impulse advances followed by corrective declines is established we will maintain a bullish bias so long as USDZAR remains above 13.7985.
The RSI divergence coming into the recent high tips the hand that this smaller impulse wave is nearing an end. Therefore, it would be considered normal for USDZAR to correct back towards 14.00-14.10. If such a correct takes place, we will look for bullish symptoms to emerge.
USDZAR Medium Term Targets
If this analysis is correct and if USD/ZAR continues its push higher, a couple of resistance levels include 14.45 and 14.85. These levels are derived by calculating the distance of the January 31 to February 14 wave with the Fibonacci extension tool and projecting a .618 or equal wave measurement from the February 25 low. We know from our Elliott wave studies that alternating waves tend to have Fibonacci or equal wave proportions.
USDZAR bottom line
USDZAR may dip to the lower 14’s to correct the recent advance. A bullish bias is maintained while holding above 13.80 with a bullish hot spot on a dip to 14.10 or a breakout above recent highs.
---Written by Jeremy Wagner, CEWA-M
Jeremy Wagner is a Certified Elliott Wave Analyst with a Master’s designation. These articles are designed to illustrate Elliott Wave applied to the current market environment. See Jeremy’s bio page for recent Elliott Wave articles to see Elliott Wave Theory in action.
How can I learn more about Elliott wave?
We have a beginners and advanced Elliott wave trading guides. Print off those guides and study the patterns. The two most comment patterns are impulse waves and zigzags. By understanding their structure and common Fibonacci relationships, you’ll have a great start to learning Elliott wave.
After reviewing the guides above, be sure to follow future Elliott Wave articles to see Elliott Wave Theory in action.
Not sure if Elliott wave is right for you? Believe it or not, when I first started trading I couldn’t understand why technical analysis worked. Now, I’m 100% technical through Elliott wave. Learn more about how Jeremy got started into Elliott wave from this podcast interview with DailyFX’s Global Markets Decoded.
Discuss this market with Jeremy in Monday’s US Opening Bell webinar.
Follow on twitter @JWagnerFXTrader .
Recent Elliott Wave analysis you might be interested in…
WTI Crude Oil Reaches a Decision Point on Price Chart
Gold and Silver Trade on their Heels
NZDUSD Elliott Wave Analysis: Triangle Takes Over


