


Near-term Technical Outlook: Trade Setups on USD/CAD, EUR/USD & AUD/USD
- Technical charts on trade setup we’ve been tracking in USD/CAD, EUR/USD & AUD/USD
- Key Loonie range-break pending / Aussie threatens new lows towards trend support
- Euro approaching key support pivot - trader sentiment highlights risk of reversal
An update on trade setups we've been tracking in Loonie, Euro & Aussie. These are the targets and invalidation levels that matter next week. Review my latest Strategy Webinar for an in-depth breakdown of thesetrade setups and more.
Canadian Dollar Price Chart - USD/CAD 60min
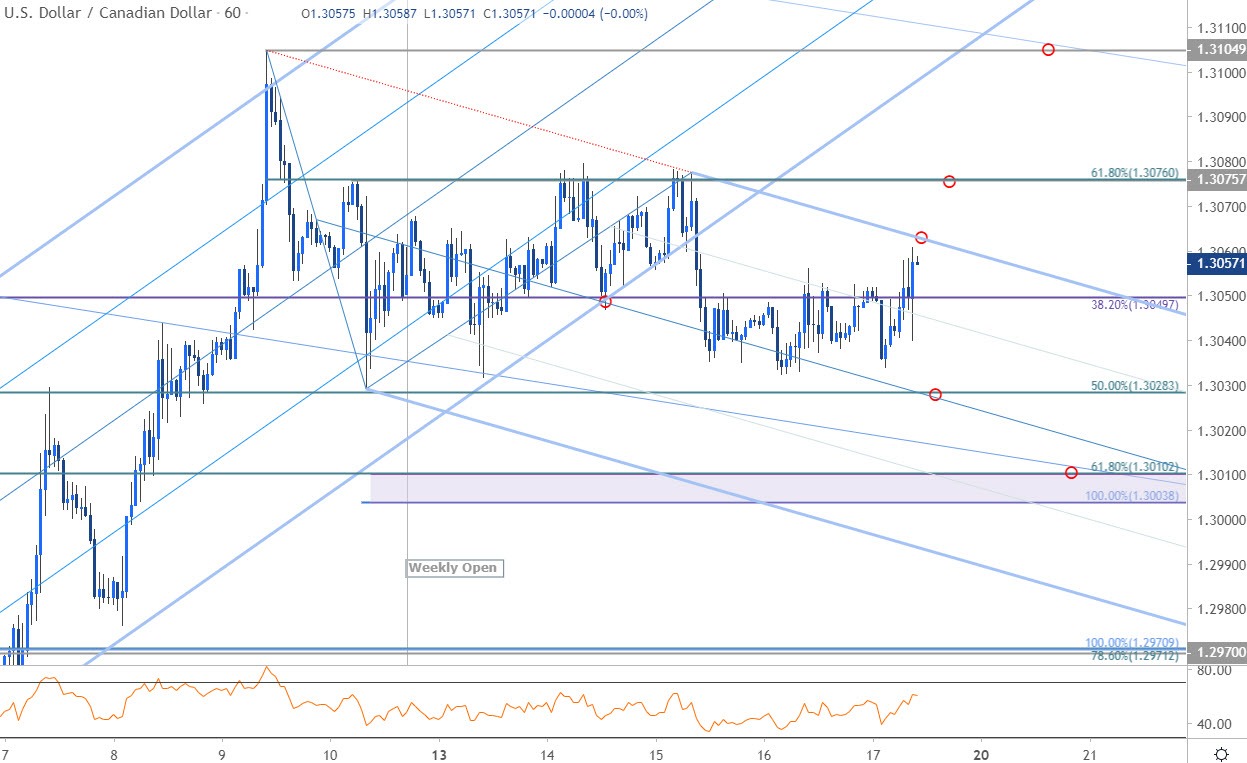
Chart Prepared by Michael Boutros, Technical Strategist; USD/CAD on Tradingview
In my latest Canadian Dollar Price Outlook we noted that USD/CAD was in a, “near-term consolidation just above uptrend support and the immediate focus is on a break of the weekly opening-range for guidance. From a technical standpoint, the setup remains constructive while within this formation, but we’ll respect a break of the 1.3024-1.3076 range.” The range is preserved and the game-plain is unchanged heading into the close of the week with Loonie on the defensive into the open of trade on Friday.
Initial support at 1.3050 with a break below 1.3028 still needed to fuel the next leg lower in price targeting 1.3004/10. A topside breach of this descending pitchfork still must best 1.3076 to fuel the next leg higher in price. Bottom line: From a trading standpoint, heading into next week the focus remains on a break of this key range for guidance. Review my latest Canadian Dollar Weekly Price Outlook for a closer look at the longer-term USD/CAD technical trading levels.
Canadian Dollar Trader Sentiment – USD/CAD Price Chart

- A summary of IG Client Sentiment shows traders are net-long USD/CAD - the ratio stands at +1.25 (55.54% of traders are long) – weak bearish reading
- Long positions are 1.43% higher than yesterday and 5.52% lower from last week
- Short positions are 8.74% lower than yesterday and 43.32% higher from last week
- We typically take a contrarian view to crowd sentiment, and the fact traders are net-long suggests USD/CAD prices may continue to fall. Yet traders are more net-long than yesterday but less net-long from last week and the combination of current positioning & recent changes gives us a further mixed USD/CAD trading bias from a sentiment standpoint.
| Change in | Longs | Shorts | OI |
| Daily | 1% | -11% | -7% |
| Weekly | 39% | -19% | -1% |
Euro Price Chart - EUR/USD 120min
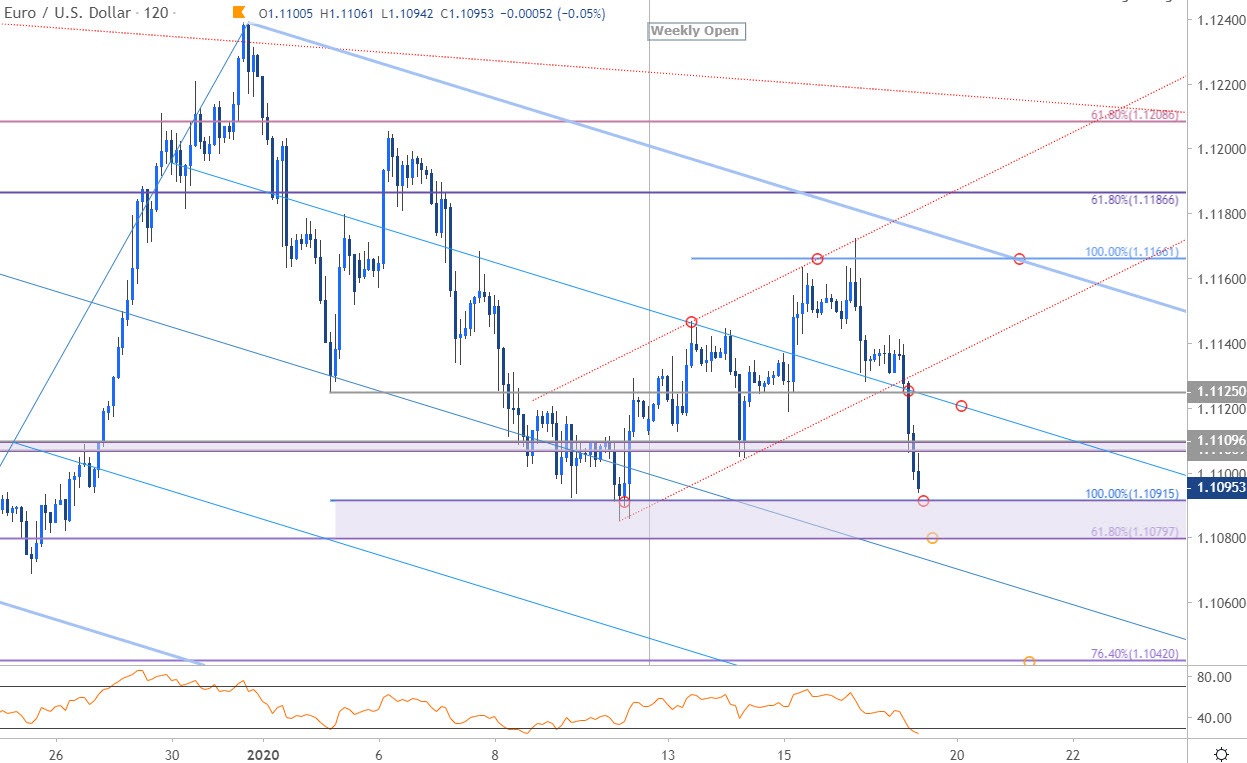
Chart Prepared by Michael Boutros, Technical Strategist; EUR/USD on Tradingview
In my most recent EUR/USD Technical Price Outlook we noted that the, “immediate focus is on a reaction as the Euro recovery approaches initial resistance objectives just higher.” The level in focus was the 100% Fibonacci extension of the advance off the monthly lows at 1.1166- price registered a high at 1.1172 before reversing sharply with the decline breaking near-term up-channel support. The sell-of is now approaching a key support zone Euro reacted too last week at 1.1080/91- looking for a reaction here into the close / open of the week.
From a trading standpoint, the near-term risk remains lower while below 1.1125 with a break from here exposing 1.1042. That said, we’re on the lookout for an exhaustion low next week closer to daily uptrend support. Review my latest Euro Weekly Price Outlook for a look at the longer-term EUR/USD technical trade levels.
Euro Trader Sentiment – EUR/USD Price Chart

- A summary of IG Client Sentiment shows traders are net-long EUR/USD - the ratio stands at +1.27 (55.89% of traders are long) – weak bearish reading
- Long positions are 5.63% lower than yesterday and 24.56% higher from last week
- Short positions are1.32% higher than yesterday and 3.82% lower from last week
- We typically take a contrarian view to crowd sentiment, and the fact traders are net-long suggests EUR/USD prices may continue to fall. Yet traders are less net-long than yesterday but more net-long from last week and the combination of current positioning and recent changes gives us a further mixed EUR/USD trading bias from a sentiment standpoint.

Australian Dollar Price Chart – AUD/USD 120min
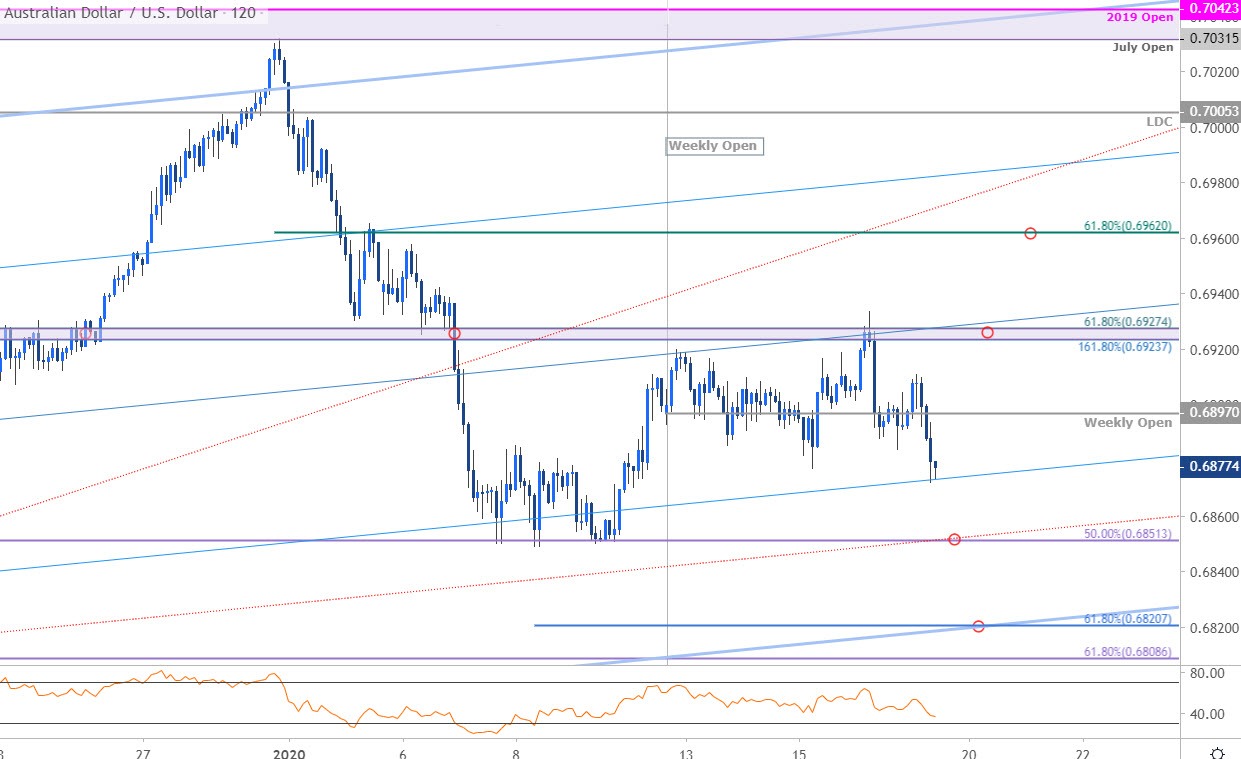
Chart Prepared by Michael Boutros, Technical Strategist; AUD/USD on Tradingview
In this week’s Australian Dollar Price Outlook we highlighted a key technical range between 6851-6927 with the, “broader outlook weighted to the topside in Aussie while above 6809. From at trading standpoint, look for possible downside exhaustion while above the lower parallel with a breach above the median-line needed to mark resumption.” Price registered a high this week at 6933 before turning lower with Aussie testing slope support on Friday afternoon in New York.
The threat remains for a deeper correction while below 6927 with a break lower exposing 6851 and the 61.8% retracement / extension at 6821- both levels of interest for possible downside exhaustion IF reached. Topside resistance objectives unchanged at 6962 in the event of a breach. Review my latest Australian Dollar Weekly Price Outlook for a look at the longer-term AUD/USD technical trade levels.
For a complete breakdown of Michael’s trading strategy, review his Foundations of Technical Analysis series on Building a Trading Strategy

-Written by Michael Boutros, Currency Strategist with DailyFX
Follow Michaelon Twitter @MBForex


