


Gold (XAU/USD) Price and Analysis
- The precious metal falls sharply as risk assets rally during Israel-Iran conflict lull.
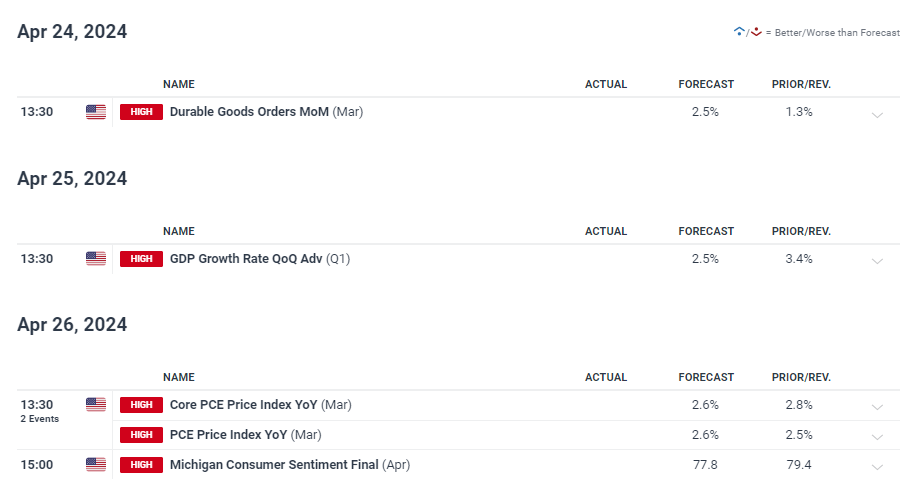
- US Q1 GDP and Core PCE data will drive price action later this week.
Download our latest Gold Technical and Fundamental Forecasts for Free

Most Read: Understanding Inflation and its Global Impact
The recent lull in the Israel-Iran conflict is giving risk assets a slight boost and drawing attention away from haven assets including gold. This week’s Passover (Pesach) religious holiday has quietened hostilities between the two countries, leaving haven assets on the sidelines, for now at least. Gold has rallied sharply on the recent risk off move and is giving back a small percentage of its recent gains as traders move into riskier asset classes.
Later this week, three important US economic data releases will hit the screens and each of them has the ability to shift market momentum. While US Durable Goods is always worth noting, this week sees two heavyweight releases, the first look at Q1 GDP and the Fed’s preferred inflation gauge, Core PCE. US Q1 GDP is seen falling to 2.5% from a prior quarter’s 3.4%, a still robust number and one that will do little to change the Fed’s plans for rate cuts. A higher-than-forecast number however may push rate cuts back further. The Core PCE release is forecast to show core inflation falling further towards target, while headline inflation may tick up slightly. These numbers will be closely looked into and may well shift rate expectations, in the short term at least.
Gold is now trading back under $2,300/oz. and is testing the 20-day simple moving average. A close and open below this indicator will leave gold vulnerable to further losses although the strength of the recent rally should see $2,800/oz. and $2,300/oz. act as reasonable levels of support. Below here $2,193 comes into focus but this level may be a stretch unless the conflict in the Middle East calms further.
Learn How to Trade Gold with our Expert Guide

Gold Daily Price Chart
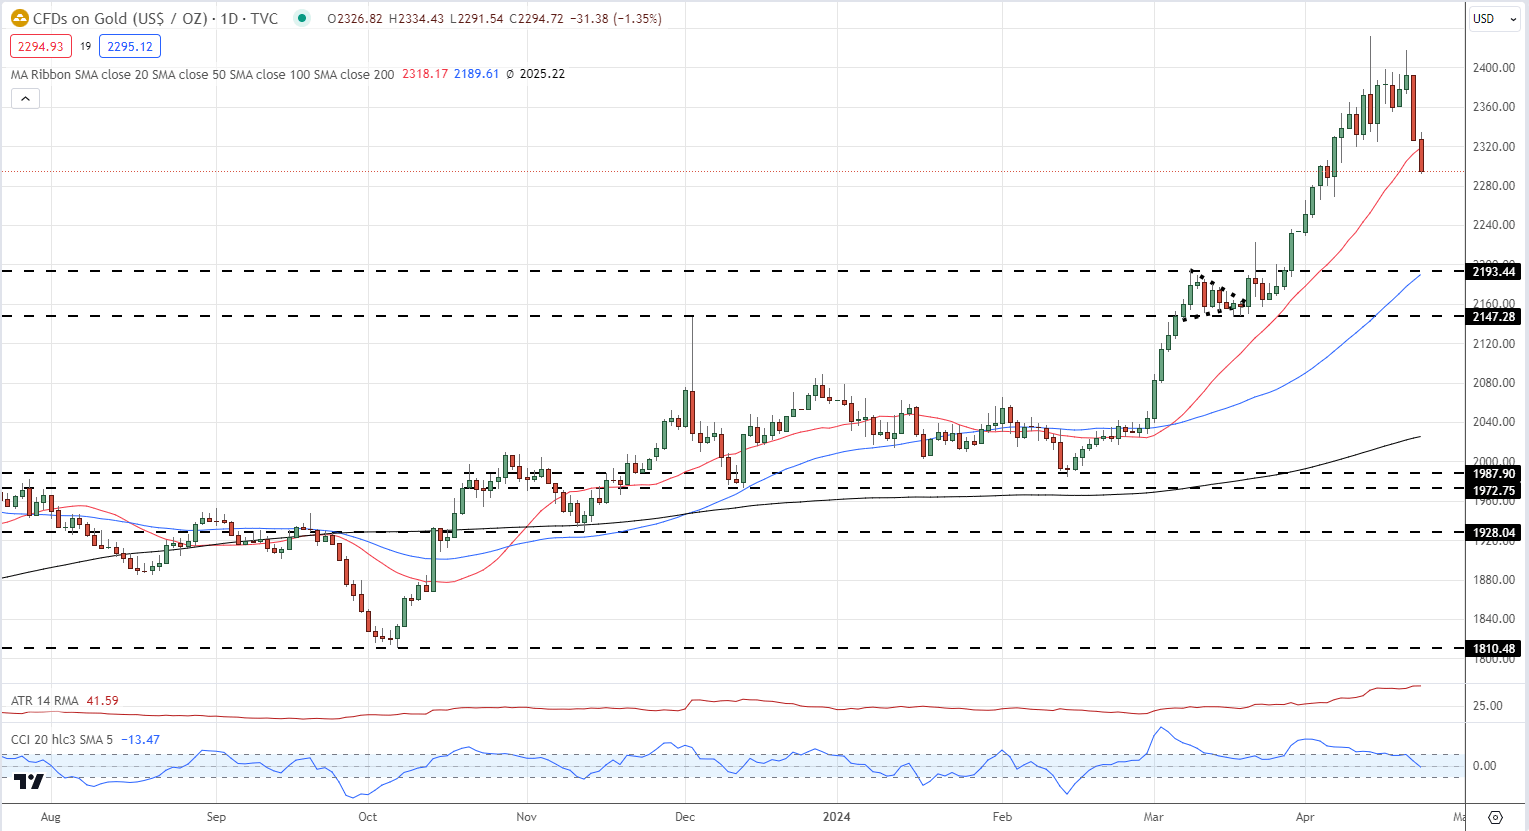
Chart via TradingView
Retail trader data shows 54.89% of traders are net-long with the ratio of traders long to short at 1.22 to 1.The number of traders net-long is 4.10% higher than yesterday and 2.03% higher from last week, while the number of traders net-short is 10.85% lower than yesterday and 12.96% lower from last week.
We typically take a contrarian view to crowd sentiment, and the fact traders are net-long suggests Gold prices may continue to fall.
See the Full Report Below:
| Change in | Longs | Shorts | OI |
| Daily | -6% | -5% | -6% |
| Weekly | -2% | -9% | -5% |
What is your view on Gold – bullish or bearish?? You can let us know via the form at the end of this piece or you can contact the author via Twitter @nickcawley1.


