


- EUR/USD, USD/CAD, AUD/USD weekly technical levels heading into 2020 trade
- Check out our 2020 projections in our Free DailyFX USD Trading Forecasts
- Join Michael for Live Weekly Strategy Webinars on Mondays at 12:30GMT
The US Dollar is targeting key technical targets into the close of 2019 with the majors eyeing major inflection zones near trend extremes. While further Dollar losses are expected in the months ahead, the immediate decline may be vulnerable as we kick-off January trade and we’re looking for a reaction into the open. These are the updated targets and invalidation levels that matter on the Euro, Canadian Dollar and Australian Dollar weekly price charts.

Euro Price Chart – EUR/USD Weekly

Chart Prepared by Michael Boutros, Technical Strategist; EUR/USD on Tradingview
Notes: In my last Euro Weekly Price Outlook we noted a constructive bias on EUR/USD while above the 1.0976/94 support threshold with key topside resistance objectives eyed at 1.1187-1.1209. Price has been testing this critical Fibonacci confluence for the past four-weeks and defines the December opening-range highs. Look for a pivot off this threshold into the yearly open with a breach / close above the 2019 January channel line needed to fuel / validate a larger turn in price. Initial support remains with the 1.44% parallel (currently ~1.1060s) with broader bullish invalidation steady at 1.0976. Review my latest Euro Price Outlook for a closer look at the EUR/USD near-term technical trade levels.
Euro Trader Sentiment – EUR/USD Price Chart
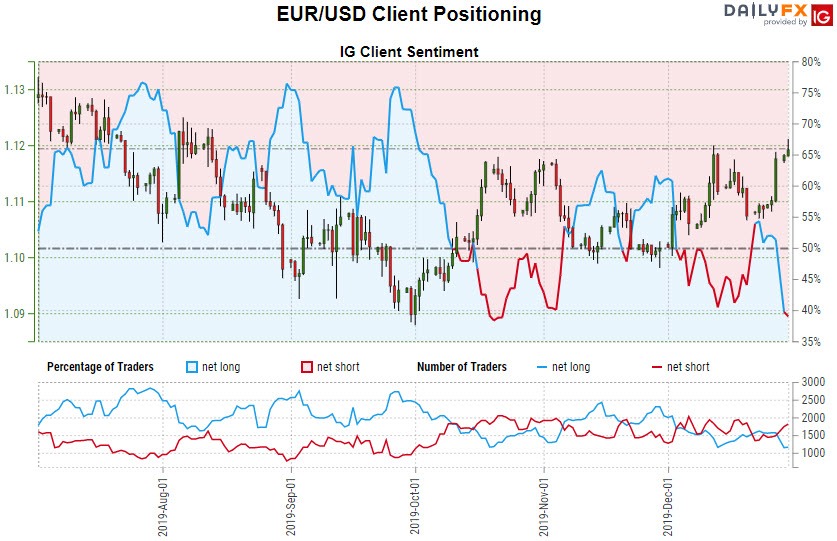
- A summary of IG Client Sentiment shows traders are net-short EUR/USD - the ratio stands at -1.52 (39.74% of traders are long) – bullish reading
- Long positions are 11.34% higher than yesterday and 24.81% lower from last week
- Short positions are11.14% higher than yesterday and 29.43% higher from last week
- We typically take a contrarian view to crowd sentiment, and the fact traders are net-short suggests EUR/USD prices may continue to rise. Yet traders are less net-short than yesterday but more net-short from last week and the combination of current positioning and recent changes gives us a further mixed EUR/USD trading bias from a sentiment standpoint.
| Change in | Longs | Shorts | OI |
| Daily | -1% | -4% | -3% |
| Weekly | 4% | -10% | -5% |
Canadian Dollar Price Chart – USD/CAD Weekly
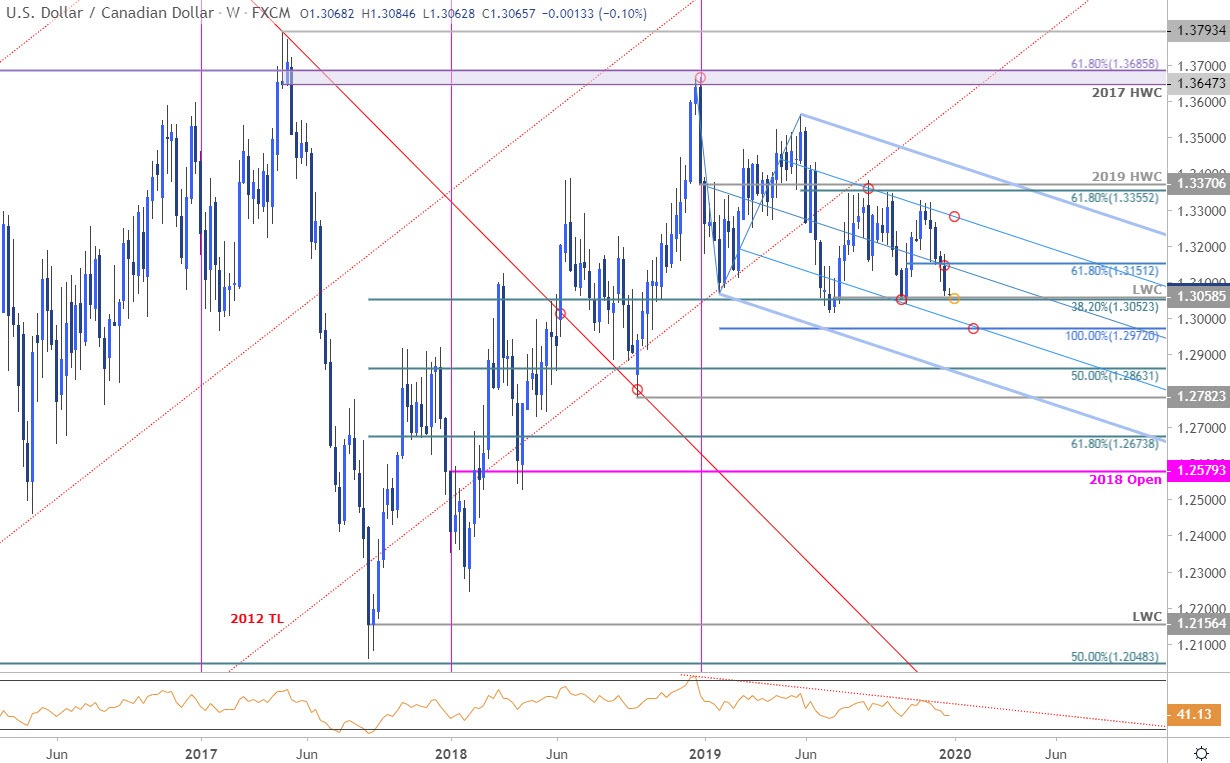
Chart Prepared by Michael Boutros, Technical Strategist; USD/CAD on Tradingview
Notes: In my last Canadian Weekly Price Outlook we noted that, “USD/CAD responded downtrend support AND resistance into the open of the month and the immediate focus is on a break of last week’s range for guidance” -with a downside break ultimately favored. A five-week consecutive decline takes price back towards key support at the lower bounds of a multi-month consolidation patter at 1.3052/58- look for a reaction there into the January open with a break / close below needed to keep the focus on subsequent objectives at the 100% Fibonacci extension at 1.2972 and 1.2863. Resistance steady at 1.3152 with bearish invalidation set to the 75% parallel, currently just shy of 1.33. Review my latest Canadian Dollar Price Outlook for a closer look at the USD/CAD near-term technical trade levels.
Canadian Dollar Trader Sentiment – USD/CAD Price Chart
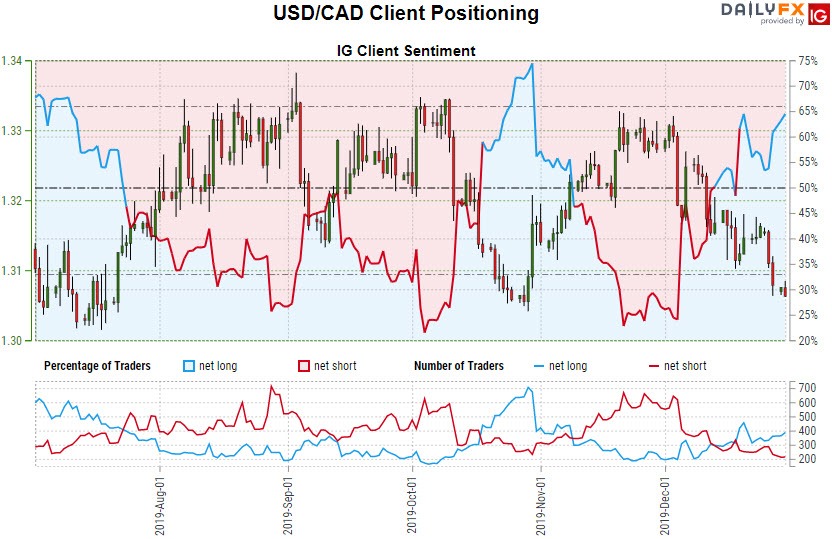
- A summary of IG Client Sentiment shows traders are net-long USD/CAD - the ratio stands at +1.87 (65.18% of traders are long) – bearish reading
- Long positions are 16.53% higher than yesterday and 8.18% higher from last week
- Short positions are6.60% higher than yesterday and 18.12% lower from last week
- We typically take a contrarian view to crowd sentiment, and the fact traders are net-long suggests USD/CAD prices may continue to fall. Traders are further net-long than yesterday & last week, and the combination of current positioning and recent changes gives us a stronger USD/CAD-bearish contrarian trading bias from a sentiment standpoint.
| Change in | Longs | Shorts | OI |
| Daily | -2% | 7% | 5% |
| Weekly | -30% | 38% | 13% |
Australian Dollar Price Chart – AUD/USD Weekly
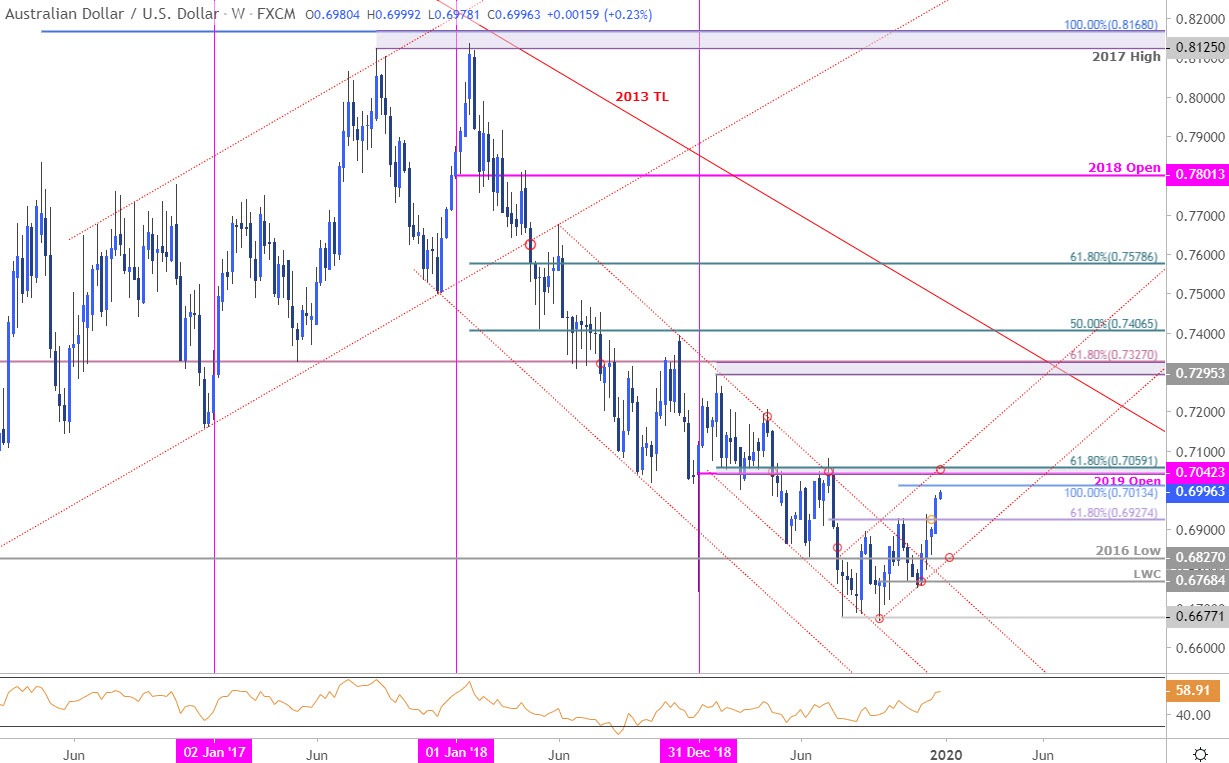
Chart Prepared by Michael Boutros, Technical Strategist; AUD/USD on Tradingview
Notes: In my last Australian Dollar Weekly Price Outlook we noted a constructive outlook while above 6800 with initial topside targets eyed at 7013 and the 2019 objective yearly open / 61.8% retracement at 7042/59(critical). Aussie is attempting a fifth consecutive weekly rally with the advance now within striking distance just ahead of the yearly close. Initial support now 6927 with bullish invalidation raised to the 2016 low at 6827. Look for a breach above 60 in weekly RSI to mark a change in the momentum profile- that would mark the highest reading since the January 2018 high.
Australian Dollar Trader Sentiment – AUD/USD Price Chart

- A summary of IG Client Sentiment shows traders are net-short AUD/USD - the ratio stands at -1.06 (48.5% of traders are long) – neutral reading
- Long positions are 9.48% higher than yesterday and 12.07% lower from last week
- Short positions are11.98% higher than yesterday and 7.39% higher from last week
- We typically take a contrarian view to crowd sentiment, and the fact traders are net-short suggests AUD/USD prices may continue to rise. Traders are further net-short than yesterday & last week, and the combination of current sentiment and recent changes suggests a more bullish-AUD/USD contrarian trading bias from a sentiment standpoint.
| Change in | Longs | Shorts | OI |
| Daily | 2% | 3% | 2% |
| Weekly | 29% | -46% | 0% |
For a complete breakdown of Michael’s trading strategy, review his Foundations of Technical Analysis series on Building a Trading Strategy
Previous Weekly Technical Charts
--- Written by Michael Boutros, Technical Currency Strategist with DailyFX
Follow Michael on Twitter @MBForex


