


- Crude Oil price rally key resistance into the close of the year at ~61.40s
- New to Oil Trading? Get started with this Free How to Trade Oil-Beginners Guide
- Join Michael for Live Weekly Strategy Webinars on Mondays at 12:30GMT
Crude Oil prices are poised to mark the third consecutive weekly advance with WTI surging more than 11.5% off the November lows. The advance takes oil into confluence resistance at multi-month highs into the close of the year and we’re on the lookout for possible topside exhaustion in the weeks ahead. These are the updated targets and invalidation levels that matter on the oil price weekly chart. Review my latest Weekly Strategy Webinar for an in-depth breakdown of this crude oil price setup and more.

Crude Oil Price Chart – WTI Weekly
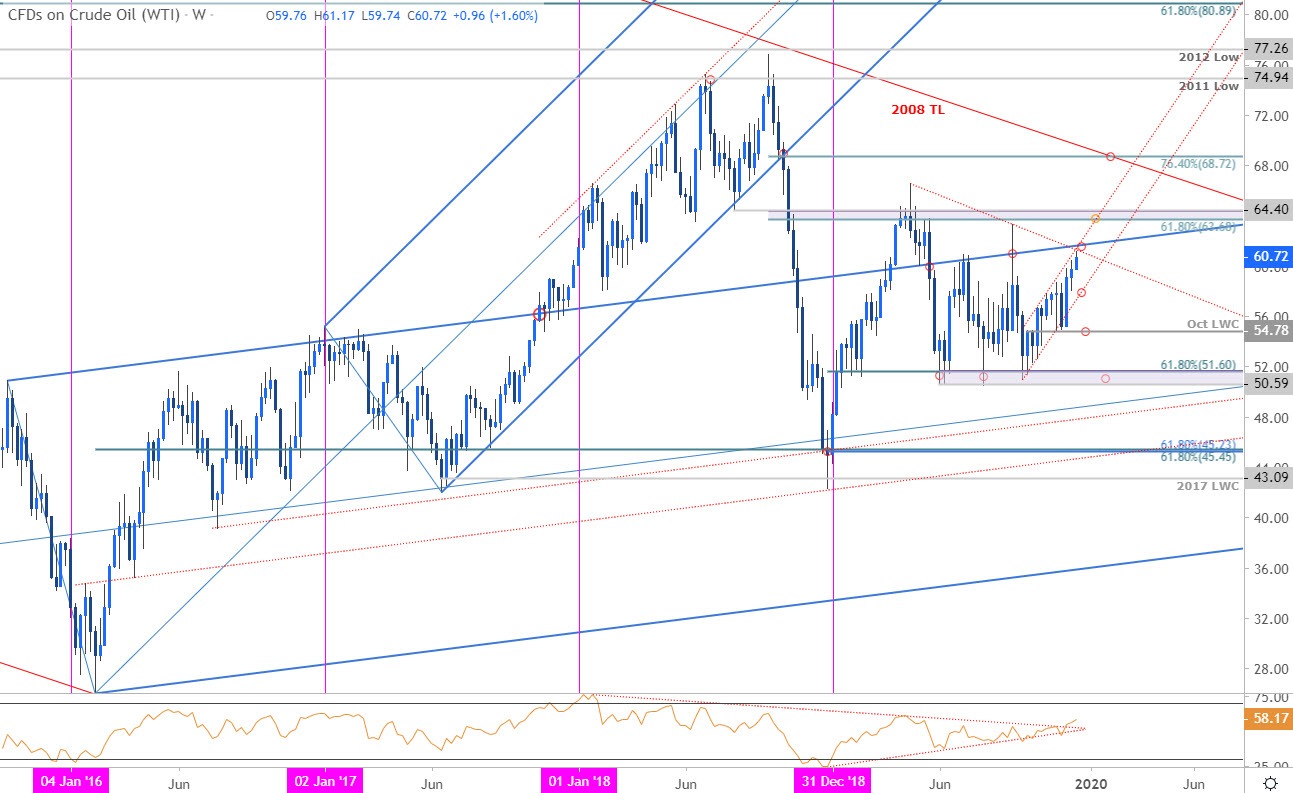
Chart Prepared by Michael Boutros, Technical Strategist; Crude Oil (WTI) on Tradingview
Notes: In my previous OilWeekly Price Outlook we noted that WTI was approaching resistance near 58.45/61 with a close above needed to, “keep the focus on subsequent topside resistance objectives at the 61.8% retracement of the April decline at 60.47 and the highlighted trendline confluence around ~61.40s.” A price breakout has already taken out initial targets with this week’s advance registering a high at 61.17 on Wednesday. Note that while an RSI resistance trigger has already broken to the topside, price remains below the April trendline and keeps oil within the confines of this broad consolidation pattern off the yearly highs.
The immediate advance may be vulnerable heading into the close of the month / year with a breach / close above the slope confluence needed to keep the long-bias viable targeting 63.60-64.40 – a region defined by the 61.8% retracement of the 2018 decline and the August 2018 swing low (look for a larger reaction there IF reached). Initial support rests with the September channel around the 58-handle backed by medium-term bullish invalidation at the October low-week close a 54.78.
For a complete breakdown of Michael’s trading strategy, review his Foundations of Technical Analysis series on Building a Trading Strategy
Bottom line: Crude oil prices are approaching confluence resistance at the upper bounds of a multi-month consolidation pattern and leaves the late-September rally vulnerable into the close of the year. From a trading standpoint, look to reduce long-exposure / raise protective stops on a stretch into channel resistance – be on the lookout for topside exhaustion IF oil closes the week below this threshold. Ultimately a larger pullback may offer more favorable long-entries while above the 54.78. I’ll publish an updated Oil Price Outlook once we get further clarity on the near-term technical trade levels.
Crude Oil Trader Sentiment – WTI Price Chart

- A summary of IG Client Sentiment shows traders are net-short crude oil - the ratio stands at -2.48 (28.72% of traders are long) – bullish reading
- Long positions are 2.90% lower than yesterday and 19.97% lower from last week
- Short positions are4.02% higher than yesterday and 28.05% higher from last week
- We typically take a contrarian view to crowd sentiment, and the fact traders are net-short suggests US crude oil prices may continue to rise. Traders are further net-short than yesterday and last week, and the combination of current positioning and recent changes gives us a stronger crude oil-bullish contrarian trading bias from a sentiment standpoint.
| Change in | Longs | Shorts | OI |
| Daily | 3% | -7% | 1% |
| Weekly | 31% | -38% | 7% |
---
Previous Weekly Technical Charts
- Australian Dollar (AUD/USD)
- Canadian Dollar (USD/CAD)
- Gold (XAU/USD)
- Euro (EUR/USD)
- New Zealand Dollar (NZD/USD)
- US Dollar (DXY)
--- Written by Michael Boutros, Technical Currency Strategist with DailyFX
Follow Michael on Twitter @MBForex


