


- NZD/USD breakout testing initial resistance objectives- constructive above-6400
- Check out our 2019 projections in our Free DailyFX USD Trading Forecasts
- Join Michael for Live Weekly Strategy Webinars on Mondays at 12:30GMT
The New Zealand Dollar is up more than 1.3% against the US Dollar since the Asia open with a breakout in NZD/USD taking price to levels not seen since August. The These are the updated targets and invalidation levels that matter on the NZD/USD weekly price chart. Review my latest Weekly Strategy Webinar for an in-depth breakdown of this Sterling price setup and more.
New to Forex Trading? Get started with this Free Beginners Guide
New Zealand Dollar Price Chart – NZD/USD Weekly

Chart Prepared by Michael Boutros, Technical Strategist; NZD/USD on Tradingview
Notes: In my last New Zealand Dollar Weekly Price Outlook we noted that Kiwi had, “marked a bearish reversal off key resistance last week and the focus is on confluence support just above the 63-handle.” Price registered a low at 6322 before rebounding with NZD/USD breaching resistance at the 2018 low close at 6436 into the open this week.
The breakout has already extended into the next major level of confluence resistance at 6506- a region where the 2018 low-week converges on the 75% parallel of the broader descending pitchfork formation. The immediate advance may be vulnerable while below this threshold near-term with interim support now at 6436 backed by the median-line (currently ~6400) – Kiwi would need to hold above this slope for the breakout to remain viable. A topside breach / close above this threshold would keep the focus on subsequent resistance objectives at the 61.8% retracement at 6564 backed closely by the upper parallel.
For a complete breakdown of Michael’s trading strategy, review his Foundations of Technical Analysis series on Building a Trading Strategy
Bottom line: The New Zealand Dollar breakout is testing the first major zone of resistance and leave the immediate advance vulnerable while below 6506. From a trading standpoint, a good spot to reduce long-exposure / raise protective stops – be on the lookout for downside exhaustion ahead of the median-line IF Kiwi is indeed heading higher with a topside breach here needed o fuel the next leg higher in price. I’ll publish an updated Kiwi Price Outlook once we get further clarity on the near-term NZD/USD technical trade levels.
New Zealand Dollar Trader Sentiment – NZD/USD Price Chart

- A summary of IG Client Sentiment shows traders are net-long NZD/USD - the ratio stands at +1.21 (54.8% of traders are long) – weak bullish reading
- Long positions are 2.96% higher than yesterday and 8.18% lower from last week
- Short positions are 9.46% lower than yesterday and 10.31% lower from last week
- We typically take a contrarian view to crowd sentiment, and the fact traders are net-long suggests NZD/USD prices may continue to fall. Traders are further net-long than yesterday and last week, and the combination of current positioning and recent changes gives us a stronger NZD/USD-bearish contrarian trading bias from a sentiment standpoint.
See how shifts in NZD/USD retail positioning are impacting trend- Learn more about sentiment!
---
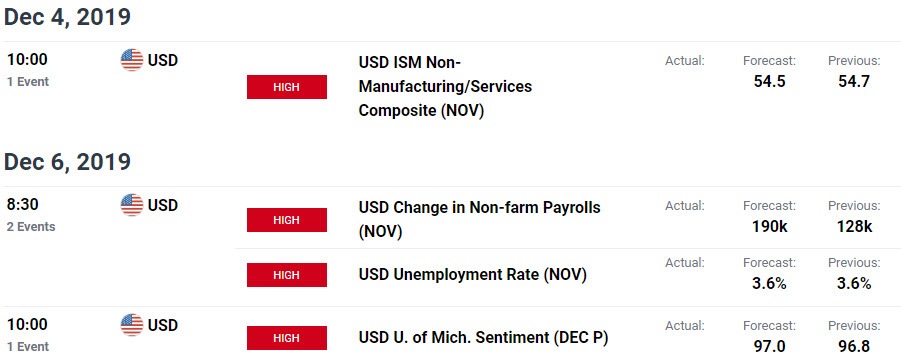
Key New Zealand / US Data Releases
Previous Weekly Technical Charts
- US Dollar (DXY)
- Japanese Yen (USD/JPY)
- Sterling (GBP/USD)
- Crude Oil (WTI)
- Gold (XAU/USD)
- Canadian Dollar (USD/CAD)
- Australian Dollar (AUD/USD)
Learn how to Trade with Confidence in our Free Trading Guide
--- Written by Michael Boutros, Technical Currency Strategist with DailyFX
Follow Michael on Twitter @MBForex


