Nasdaq 100, S&P 500, Hang Seng Analysis, and Charts
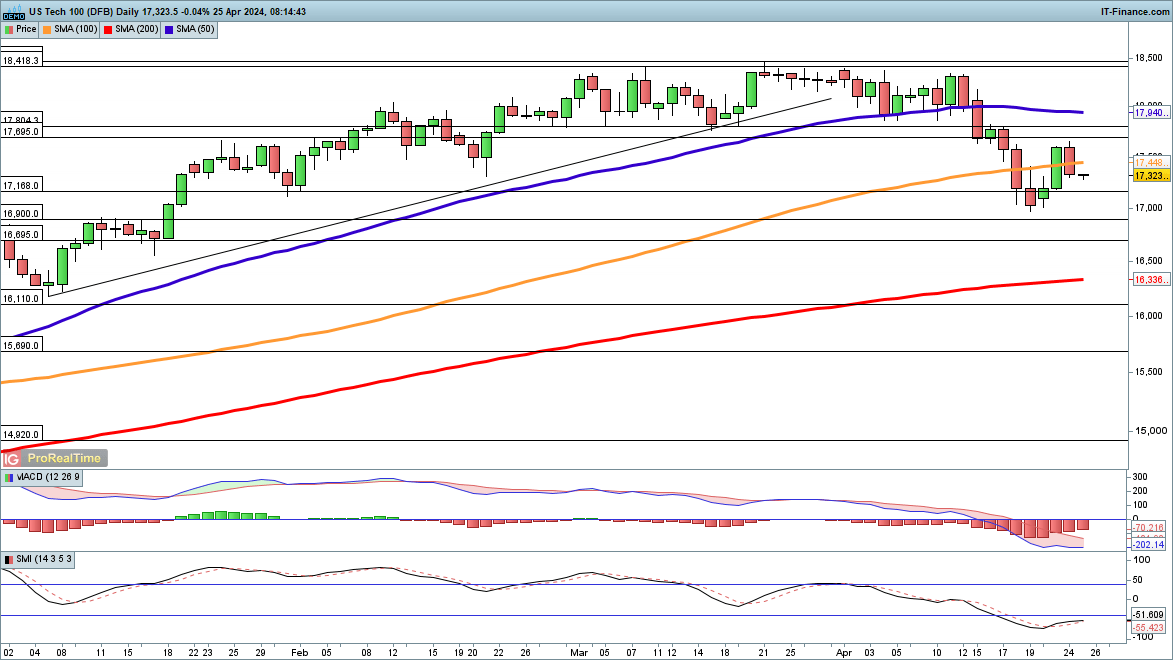
Nasdaq 100 rally torpedoed by Meta earnings
The index reversed course yesterday, giving back most of the gains made on Tuesday, as earnings from Meta soured sentiment. The price remains well above last week’s low for the time being, but with more earnings from Big Tech due in the coming week, further upward progress may be difficult. So long as the price holds above last week’s low at 16,970 then a bounce may yet materialise. A close back above 17,700 would help to bolster the bullish view.
Alternately, a close back below 16,970 will bring the late 2021 high at 16,630 into play, and then on down to the 200-day simple moving average (SMA).
Nasdaq100 Daily Chart
Download our Complimentary Q2 Equities Technical and Fundamental Forecasts Below

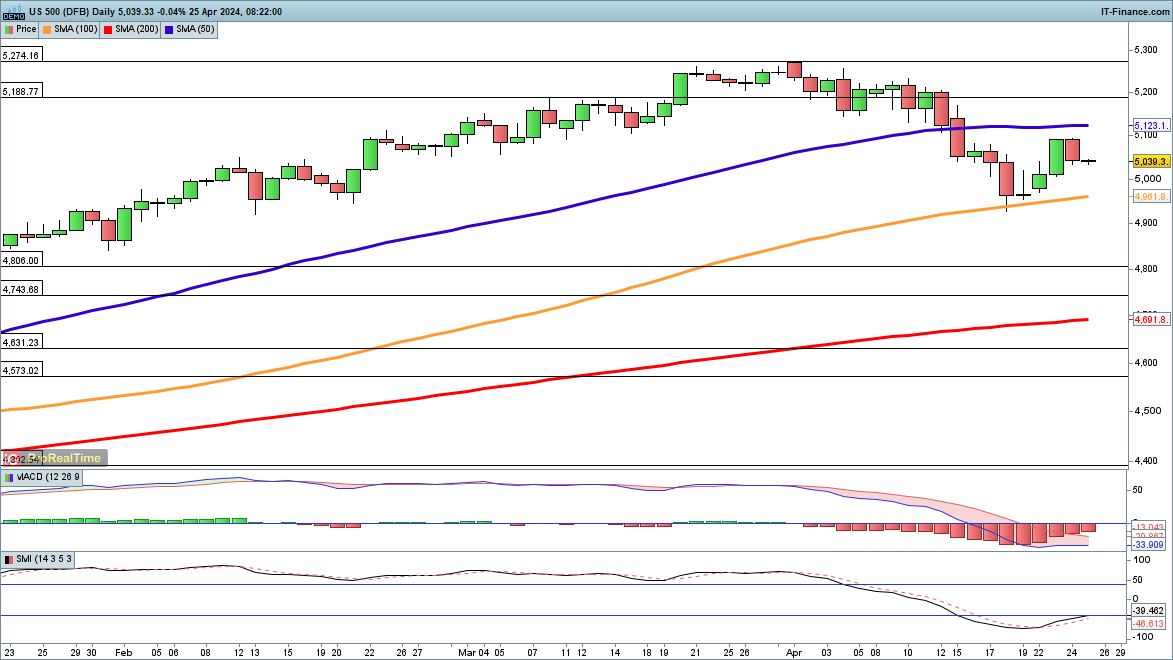
S&P 500 stumbles on tech earnings
This index also took a knock on Wednesday, though it continues to look like it has created a higher low.A pushback above the week's highs so far at 5093 would mark a bullish development, open the way to the 50-day SMA, and then on to the highs from late March at 5274.
Sellers will want to see a reversal back below the 100-day SMA and below last week’s low at 4925 to provide a more bearish view.
S&P 500 Daily Chart
Download our latest S&P 500 Sentiment Report that shows daily and weekly changes in trader positioning
| Change in | Longs | Shorts | OI |
| Daily | -11% | 8% | -1% |
| Weekly | -6% | 8% | 2% |
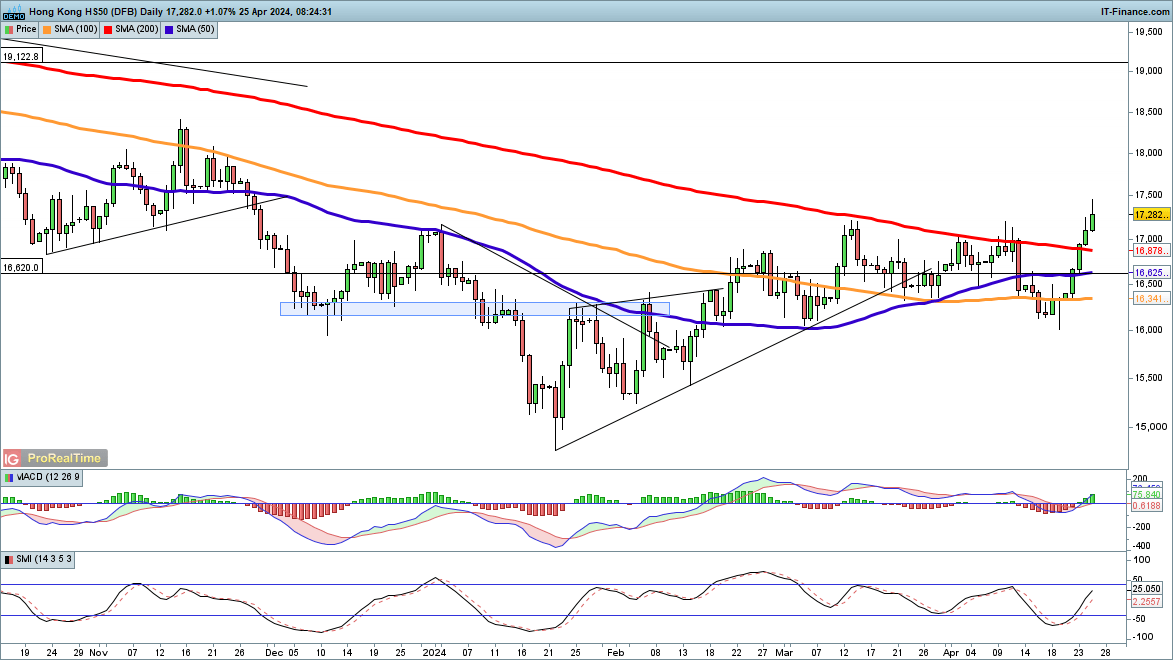
Hang Seng surges through key level
This index has seen an impressive bounce from the lows of mid-April, which has carried it above 17,000 and the 200-day SMA. It has also succeeded in closing above the latter, for the first time since July.If the price can manage a close above 17,200, then this will be a significant development. 17,200 was the high from early January, and also the peak of March and April, as well as being support from early November.Further gains target the November 2023 high around 18,300.
A reversal back below the 200-day SMA would be needed to put more of a dent in the bullish view.
Hang Seng Daily Chart