


Gold Breakout Nears as Bullish Pennant Pattern Forms
Learn how to trade gold with our free guide

The recent gold run-up has stalled over the past few days with little fundamental news or activity to help guide the precious metal. US rate cuts are coming, probably in June, while the geopolitical backdrop remains uneasy. To make a move from the current levels, there needs to be a fundamental or technical driver to help break the current inertia.
Looking at the daily gold chart, a bullish technical pattern is nearly fully formed so a breakout is due soon. A Bullish Pennant pattern is a short-term consolidation pattern that is formed by support and resistance merging. As these two lines close, a breakout occurs. If this pattern plays out, the price of gold could move considerably higher.
Pennant Patterns: Trading Bullish and Bearish Pennants
Gold Daily Price Chart Showing a Bullish Pennant Set-Up
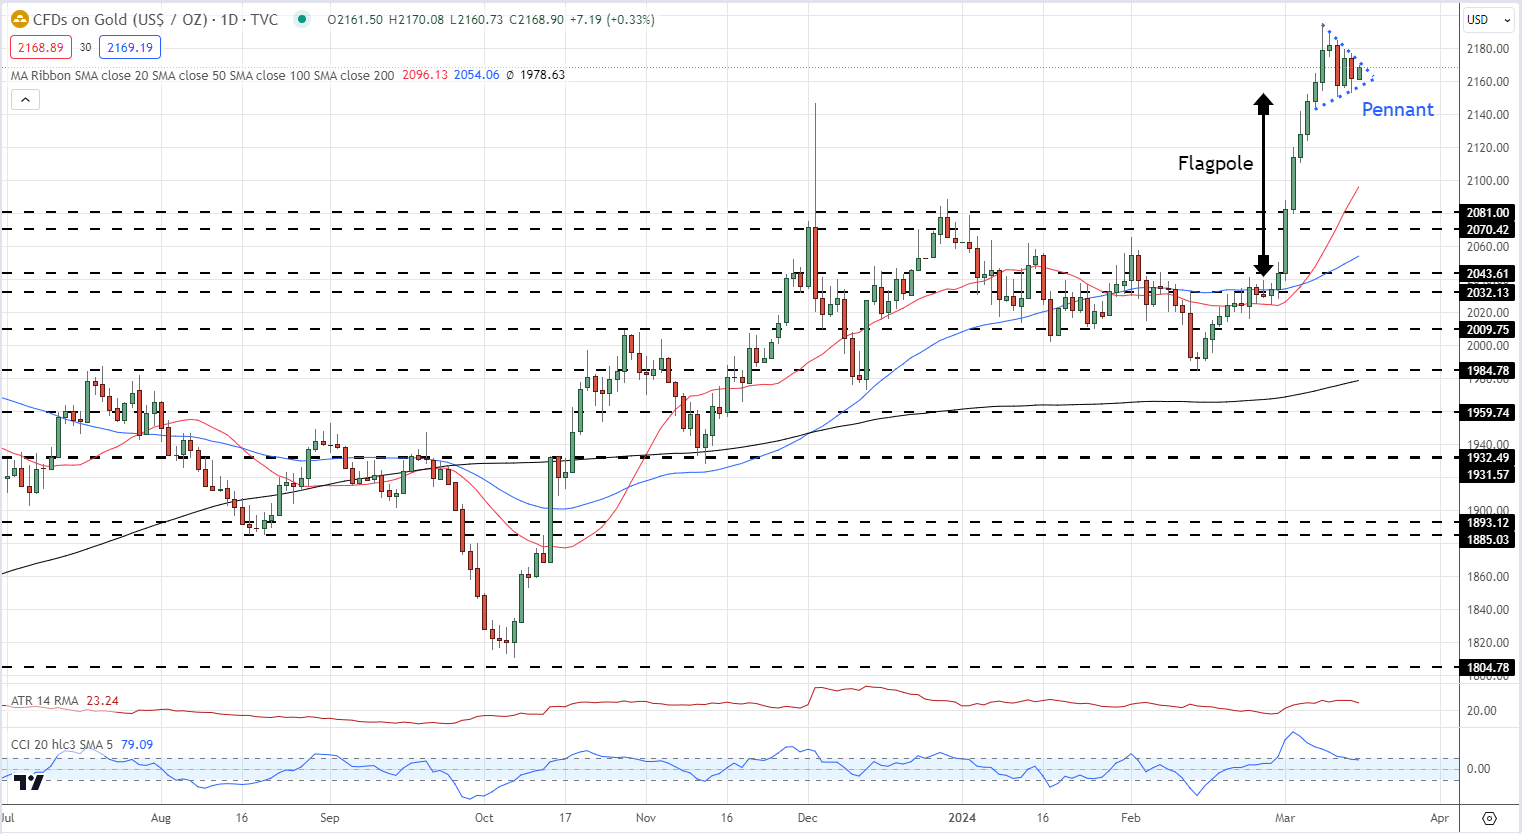
Chart via TradingView
Retail trader data 43.48% of traders are net-long with the ratio of traders short to long at 1.30 to 1.The number of traders net-long is 5.63% higher than yesterday and 4.33% higher than last week, while the number of traders net-short is 4.76% lower than yesterday and 2.70% lower than last week.
We typically take a contrarian view to crowd sentiment, and the fact traders are net-short suggests Gold prices may continue to rise.
See how daily and weekly changes in IG Retail Trader data can affect sentiment and price action.
| Change in | Longs | Shorts | OI |
| Daily | 1% | -3% | -1% |
| Weekly | 2% | -8% | -2% |
What is your view on Gold – bullish or bearish?? You can let us know via the form at the end of this piece or you can contact the author via Twitter @nickcawley1.


