FTSE 100, DAX 40, S&P 500 Analysis and Charts
Equities Q2 Forecasts - Gain valuable insights into how we think equity indices will move in the second quarter of the year with our complimentary reports

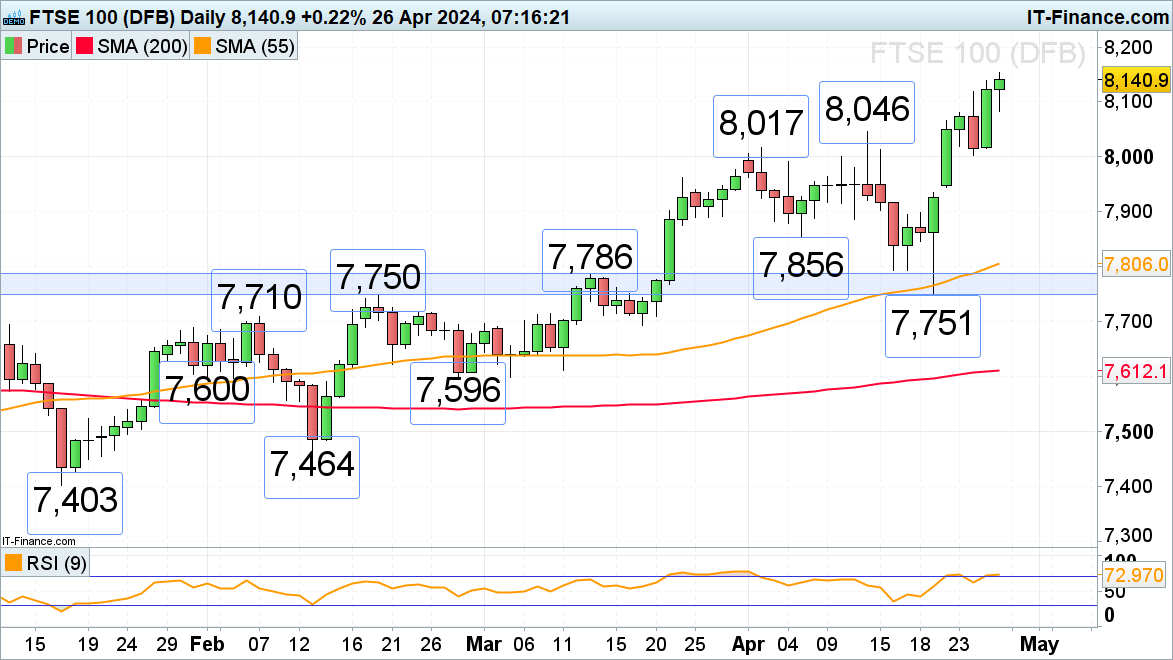
FTSE 100 hits yet another record high
Foreign investor buying of the undervalued UK blue chip index led to further gains in the FTSE 100 which is trading at yet another record high. The 8,200 zone is now in focus, above which lies the 8,300 mark which is where the 161.8% Fibonacci extension of the March-to-June 2020 advance, projected higher from the October 2020 low, can be found.
Support sits between the early-to-mid-April highs and Wednesday’s low at 8,046 to 8,003.
FTSE 100 Daily Chart
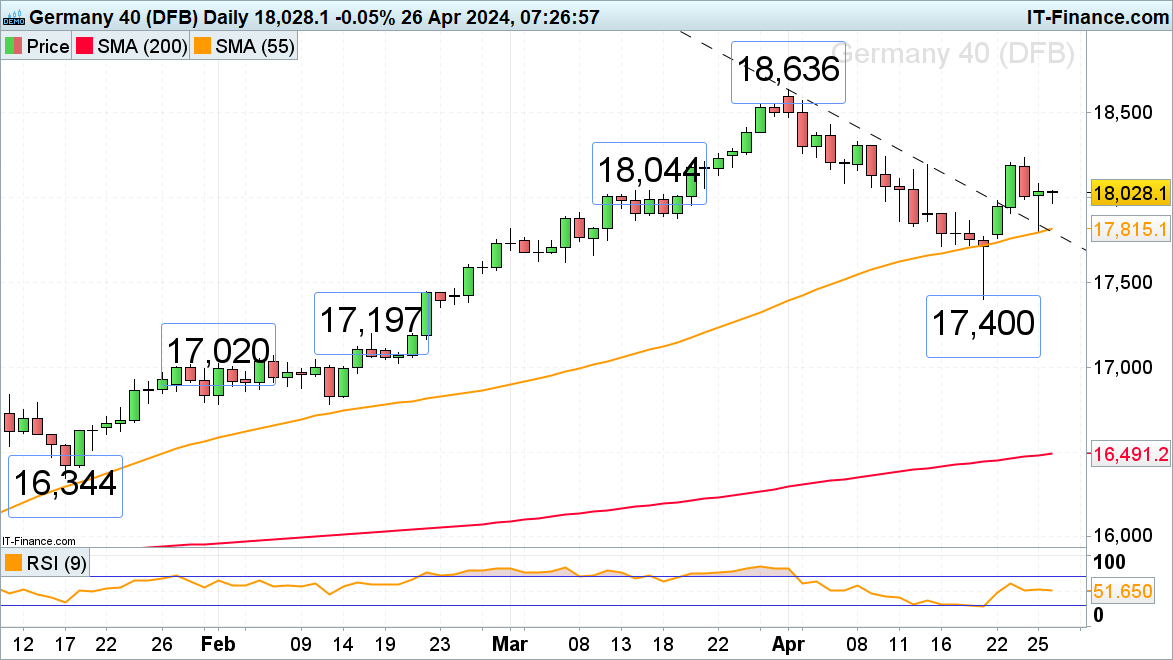
DAX 40 recovers from Thursday’s low
The DAX 40 was dragged lower by its US counterparts following the release of much weaker-than-expected preliminary Q1 GDP data but overnight recovered on better-than-expected US earnings. A rise above Thursday’s 18,080 high would engage this week’s high at 18,238 ahead of the 18,500 region.
Yesterday’s low was made along the 55-day simple moving average (SMA) at 17,815.
DAX 40 Daily Chart
Want to understand how retail positioning may impact the DAX 40 in the near term? Our sentiment guide holds all the answers.
| Change in | Longs | Shorts | OI |
| Daily | 30% | 10% | 15% |
| Weekly | -1% | -13% | -10% |
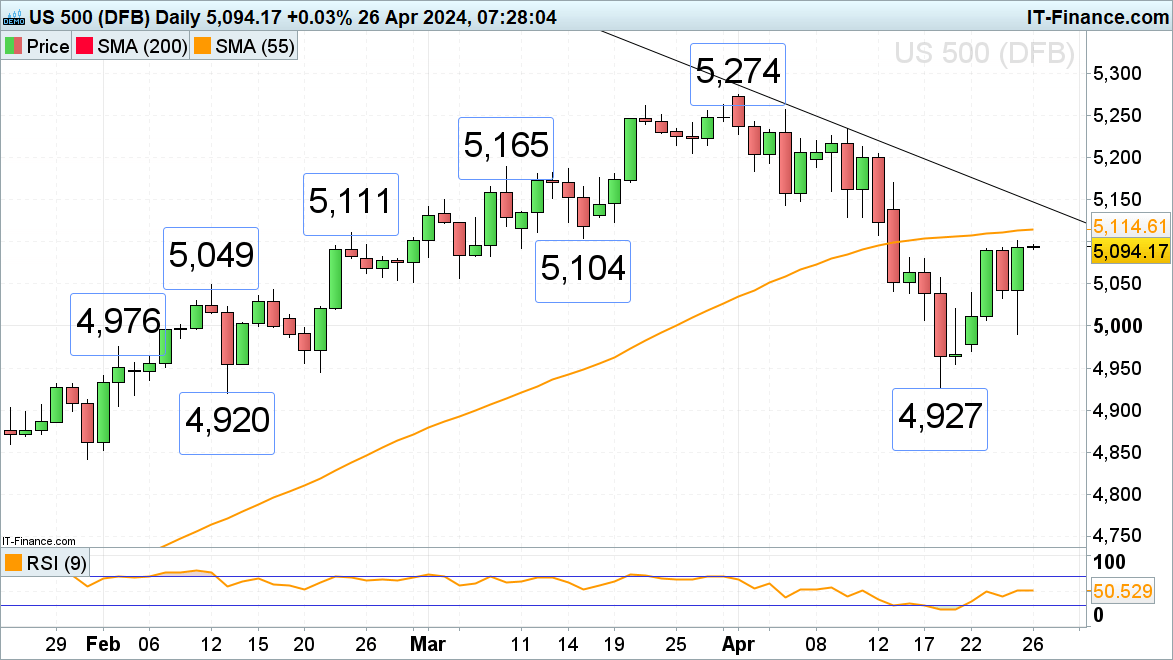
S&P 500 resumes its ascent
The S&P 500 resumes its ascent, having on Thursday slipped to 4,990 on disappointing US Q1 preliminary GDP data, before recovering on strong earnings by the likes of Alphabet, Microsoft and Snap. The index is heading towards the 55-day simple moving average (SMA) 5,114 above which the April downtrend line can be seen at 5,146.
Slips may find support can be seen around Monday’s 5,039 high.
S&P 500 Daily Chart