


Gold, Silver Analysis
- Now that the risk of a broader conflict in the Middle East has subsided, gold attempts bulls look to a softer dollar to prop up prices
- Gold (XAU/USD) attempts to lift off of support at $2320
- Silver (XAG/USD) tests Fibonacci level currently acting as resistance
- Elevate your trading skills and gain a competitive edge. Get your hands on the Gold Q2 outlook today for exclusive insights into key market catalysts that should be on every trader's radar:

Gold Bulls Looks for Inspiration in the Dollar after Tensions Subside
Implied gold volatility (GVZ) has experienced a notable drop now that the risk of a broader conflict in the Middle East has subsided massively. As a natural result, gold prices have pulled back but remain at elevated levels. Gold bulls may be looking to a slightly weaker dollar in anticipation of a bullish continuation for the metal but in recent weeks, gold has appeared detached from its usual inverse relationship with the greenback as the two have risen together.
Gold 30-Day Implied Volatility
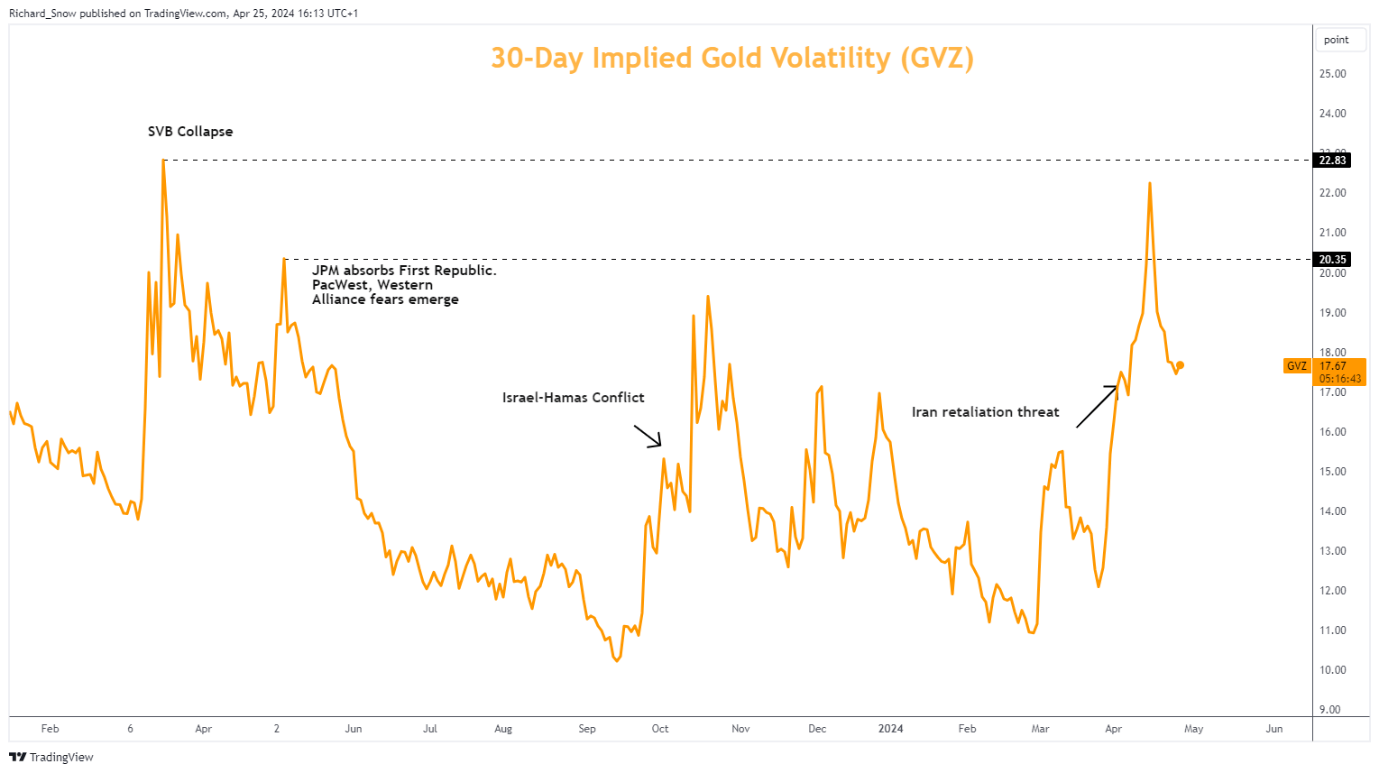
Source: TradingView, prepared by Richard Snow
Gold Attempts to Lift Off Support at $2320
Gold, after spending a significant amount of time in overbought territory, has cooled and declined towards the $2320 level where it has oscillated. With a reduced safe haven appeal, the gold market appears to be in search of the next bullish, or even bearish, catalyst.
US data has revealed early signs of vulnerability which could affect US yields and the dollar if major data points follow suit but for now the dollar still remains strong, with rate cut bets being pushed further and further out.
$2320 may offer a launchpad for gold if price action unfolds in a similar way to what developed back in March after printing a new all-time high and consolidating along $2146.80 (prior all-time high) before the next leg higher.
However, should bears take over from here, $2222 appears as the nearest level of support before the 50-day simple moving average (SMA) emerges around $2200 flat. Today’s GDP miss and the disappointing flash PMIs have opened the door to weaker US data. Something to keep an eye on in the future.
Gold Daily Chart
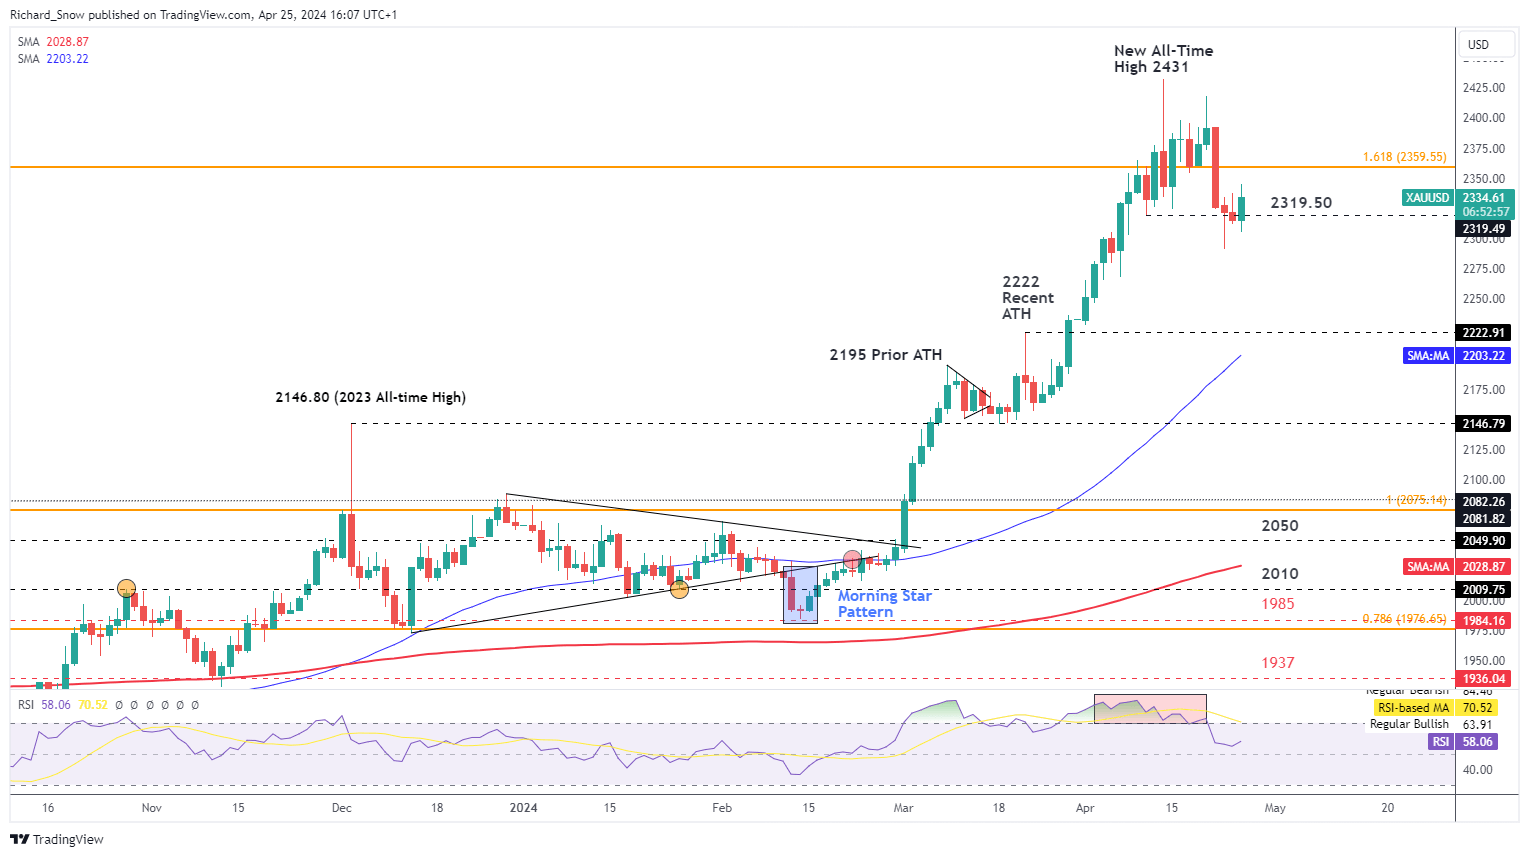
Source: TradingView, prepared by Richard Snow
Gold market trading involves a thorough understanding of the fundamental factors that determine gold prices like demand and supply, as well as the effect of geopolitical tensions and war. Find out how to trade the safe haven metal by reading our comprehensive guide:

Silver (XAG/USD) Tests Fibonacci Level Currently Acting as Resistance
Silver, similarly to gold, has also dropped sharply as risk sentiment recovered. The rise in risk tolerance provided an opportunity for Indices and high-beta currencies like the Aussie dollar and the pound to claw back losses. Speaking of risky assets, Meta’s forward guidance sent the S&P 500 lower but the magnitude is of the drop is unlikely to prompt a panicked switch to safer assets like gold and silver.
Silver hovers around the 78.6% Fibonacci retracement of the 2021 to 2022 decline at $27.40, with the level appearing to provide resistance to a possible bullish continuation. A move to the downside from here would highlight the 61.8% Fib level at $25.30 (coinciding with the 50 day SMA).
Silver Daily Chart
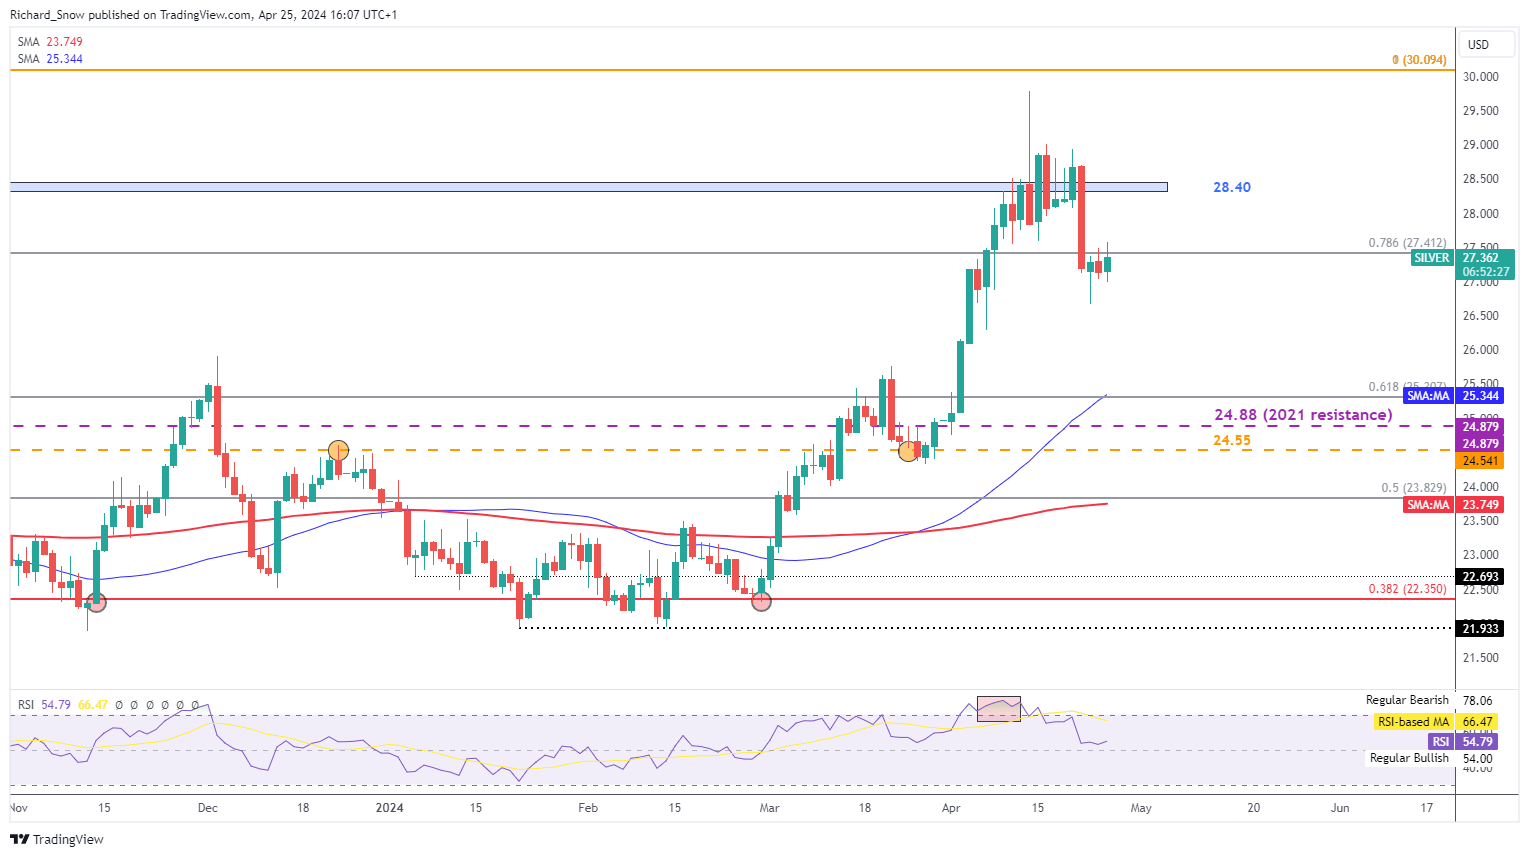
Source: TradingView, prepared by Richard Snow
--- Written by Richard Snow for DailyFX.com
Contact and follow Richard on Twitter: @RichardSnowFX


