


Gold and silver prices press lower searching for a temporary bottom. USDJPY Elliott wave pattern is longer term bullish.
The video above is a recording of a US Opening Bell webinar from April 1, 2019. We focused on the Elliott Wave patterns for key markets such as gold, silver, crude oil, DXY, EURUSD, NZDUSD, and USDJPY.
Gold prices approach wave relationships
In last week’s webinar, we highlighted how the gold price chart is showing many symptoms of a near term bearish reversal. Since last week, gold prices have fallen nearly 2.5% holding to the bearish forecast.
It is anticipated that gold would hold below Monday’s high of $1325 with some targets and wave relationships appearing below $1250. What this means is that if gold prices continue to fall below $1250, we will look for signs of a longer-term bottom forming.
Though not expected, if gold prices do run higher above $1325 before dropping below $1250, then we will need to reassess the forecast and reconsider if the multi-year Elliott wave triangle has finished and found a low.
Therefore, we are showing the current Elliott wave for gold to be wave ‘c’ (zigzag) of wave E of a triangle. We are counting the triangle as a larger wave (X) which began in July 2016.
Read more…
Top gold trading strategies and tips

Silver prices in a similar Elliott wave pattern as gold prices
Silver price forecast is similar to gold in that we are looking for continued weakness to be temporary. We believe silver is in the ‘c’ wave of a zigzag pattern. Once this ‘c’ wave exhausts, we will anticipate a large rally to $17 and possibly $19 that may take many months to complete.
Using Elliott wave relationships, we forecast this current ‘c’ wave to fall towards 14.40-14.80. From there, we are anticipating a rally to above 16.20 and possibly to 17.00 while holding above 13.89.
Read more…
Trading the gold-silver ratio: strategies and tips

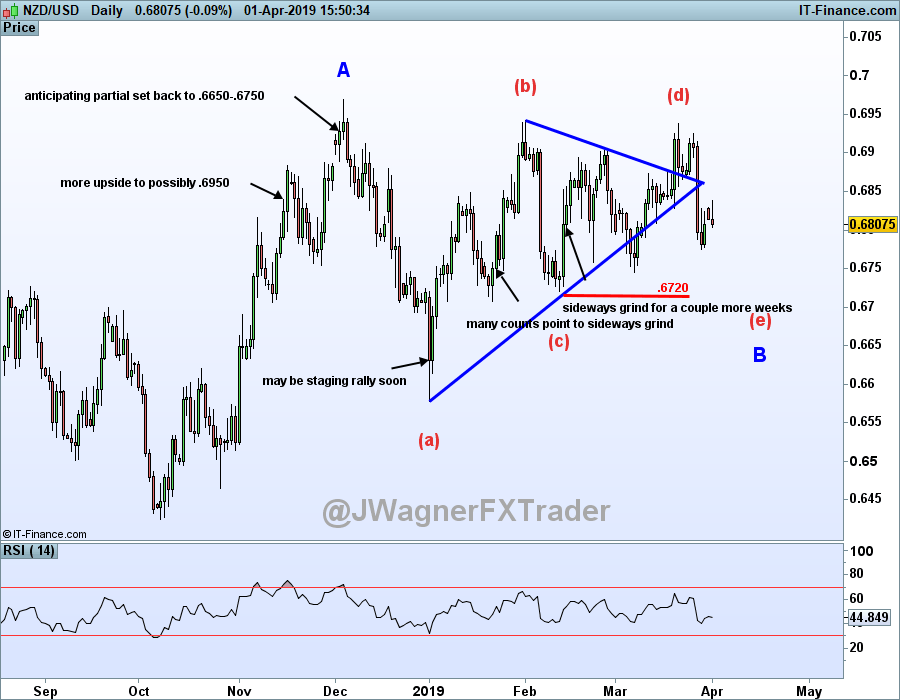
NZD/USD Breaks Temporary Key Level
In last week’s webinar we followed up to our analyst pick from two week’s ago how the Elliott wave triangle pattern may have finalized. We outlined a forecast that stated “if NZDUSD were to unexpectedly fall below .6814, then some other wave pattern is at play.”
Well, NZDUSD did fall below .6814. Therefore, it appears the Kiwi may still be consolidating inside the triangle with another complex wave. The bullish forecast is essentially delayed on a temporary basis with prices holding above .6720. Below .6720 and more options are added back for consideration.
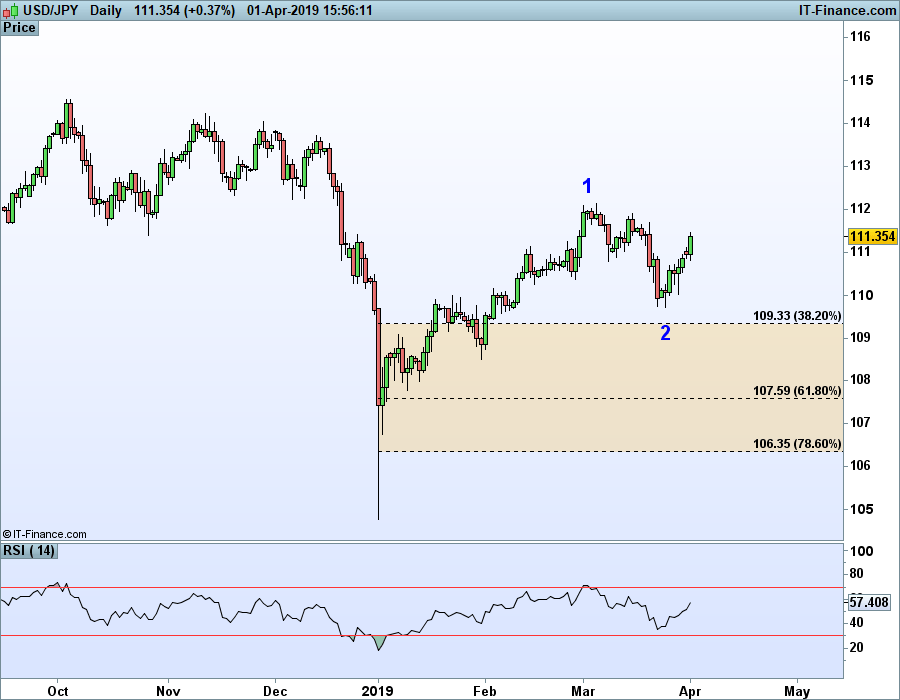
USDJPY falls but longer term bullish pattern remains
The multi-year bullish forecast yielded on January 3 remains in place despite the recent correction for USDJPY. Last week’s dip to 109.70 did meet some wave relationships. It is possible that after a brief rally to near 112, USDJPY may turn lower to retest 109.70 as the depth of the March 5 correction is a little short.
We are uncertain of the odds of a retest, but do believe that after the correction is over, a large rally may ensue as USDJPY wave be in a third wave of an impulsive wave sequence. Third waves tend to be the longest and strongest of the Elliott wave sequence. If correct, then wave 3 would break to new highs above 112 that may work up towards 117-122.
Elliott Wave Theory FAQ
How does Elliott Wave theory work?
Elliott Wave theory is a trading study that identifies the highs and lows of price movements on charts via wave patterns. Traders analyze the waves for 5-wave moves and 3-wave corrections to determine where the market is at within the larger pattern. Additionally, the theory maintains three rules and several guidelines on the depth of the waves related to one another. Therefore, it is common to use Fibonacci with Elliott Wave analysis. We cover these topics in our beginners and advanced Elliott Wave trading guides.
After reviewing the guides above, be sure to follow future Elliott Wave articles to see Elliott Wave Theory in action.
Not sure if Elliott wave is right for you? Believe it or not, when I first started trading I couldn’t understand why technical analysis worked. Now, I’m 100% technical through Elliott wave. Learn more about how Jeremy got started into Elliott wave from his podcast interview on Trading Global Markets Decoded with Tyler Yell.
---Written by Jeremy Wagner, CEWA-M
Jeremy Wagner is a Certified Elliott Wave Analyst with a Master’s designation. Jeremy provides Elliott Wave analysis on key markets as well as Elliott Wave educational resources. Read more of Jeremy’s Elliott Wave reports via his bio page.
Join Jeremy in his live US Opening Bell webinar where these markets and more are discussed through Elliott wave theory.
Follow Jeremy on Twitter at @JWagnerFXTrader .
Recent Elliott Wave analysis you might be interested in…
WTI Crude Oil Reaches a Decision Point on Price Chart


