


Gold Technical Price Outlook: XAU/USD Near-term Trade Levels
- Gold price updated technical trade levels – Daily & Intraday Charts
- XAU/USD rally extends into technical pivot zone- risk for exhaustion into November open
- New to Gold Trading? Get started with this Free How to Trade Gold -Beginners Guide
Gold prices extended into a key pivot zone last week and while the broader focus is constructive, the risk remains for exhaustion into the November open. These are the updated targets and invalidation levels that matter on the XAU/USD technical charts heading into the FOMC and US Non-Farm Payrolls this week. Review my latest Strategy Webinar for an in-depth breakdown of this gold technical setup and more.
Gold Price Chart - XAU/USD Daily
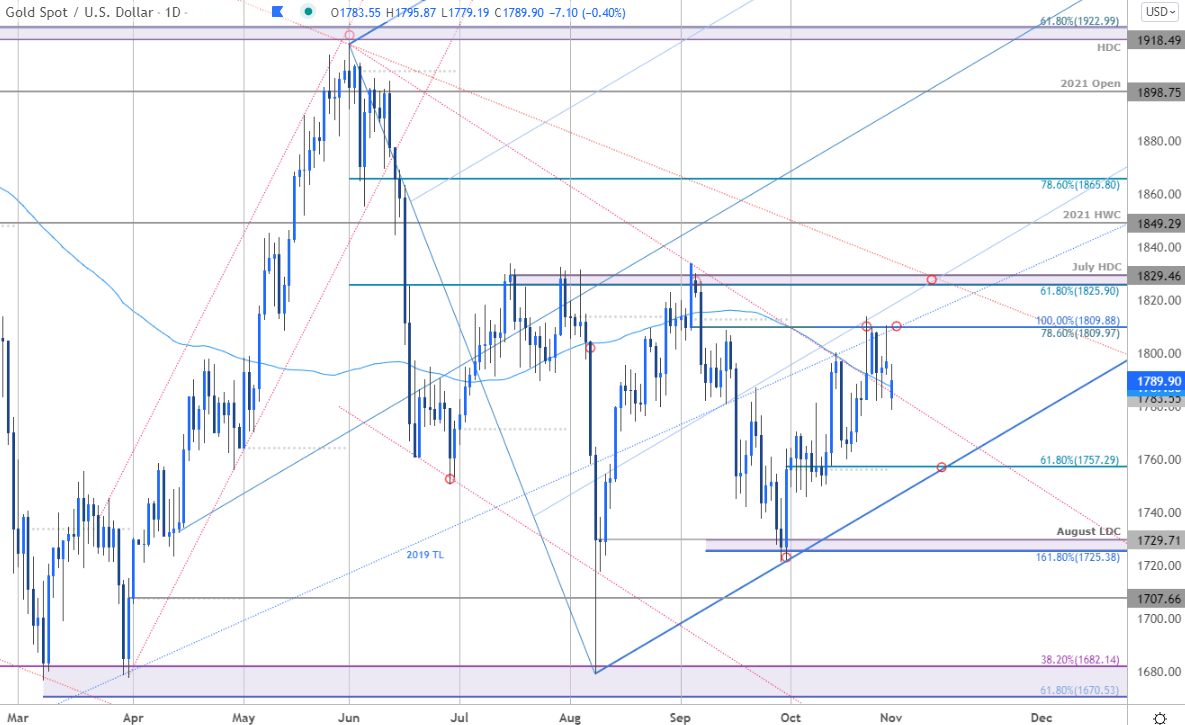
Chart Prepared by Michael Boutros, Technical Strategist; Gold on Tradingview
Technical Outlook: In last month’s Gold Price Outlook we noted that,“A pullback from a major resistance pivot last week has us looking for uptrend support on ahead of 1751.” The initial focus was on resistance at 1791/95 with a topside, “breach of the highs exposing subsequent objectives at the 100% extension at 1809 and a more critical confluence at 1825/29.” Gold had already set the low that day at 1760 before ripping higher with the advance registering a high just above the 1809 resistance target last week (high at 1813). A pullback for more than 2% off the highs is now straddling the June trendline / 100-day moving average around ~1787 into the weekly / monthly open – is the gold rally exhausting here?
Gold Price Chart - XAU/USD 240min

Notes: A closer look at Gold price action shows XAU/USD continuing to trade within the confines of the ascending pitchfork formation we’ve been tracking off the September lows. The rally is once again testing resistance at 1791/95 into the weekly open. Initial support rests at 1772 with key support now raised to the 61.8% Fibonacci retracement of the late-September rally at 1757–look for a low ahead of this threshold IF price is indeed heading higher. A topside breach of this resistance zone exposes subsequent objectives at 1809 and 1825/29 – a region defined by the 61.8% retracement of the June decline and the July high-day close (major breakout potential). Look for a larger reaction there IF reached.

Bottom line: Gold risks near-term exhaustion within the broader uptrend into the November open. From a trading standpoint, be on the lookout for a low ahead of the lower parallels with a topside breach / close above 1809 needed to fuel the next leg towards key resistance closer to 1830. Respect a break / close below 1757 with such a scenario likely to spark another bout of accelerated losses. Stay nimble into the monthly open with the FOMC interest rate decision and US NFPs on tap this week– expect volatility. Review my latest Gold Weekly Price Outlook for a closer look at the longer-term XAU/USD technical trading levels.
For a complete breakdown of Michael’s trading strategy, review his Foundations of Technical Analysis series on Building a Trading Strategy
Gold Trader Sentiment – XAU/USD Price Chart
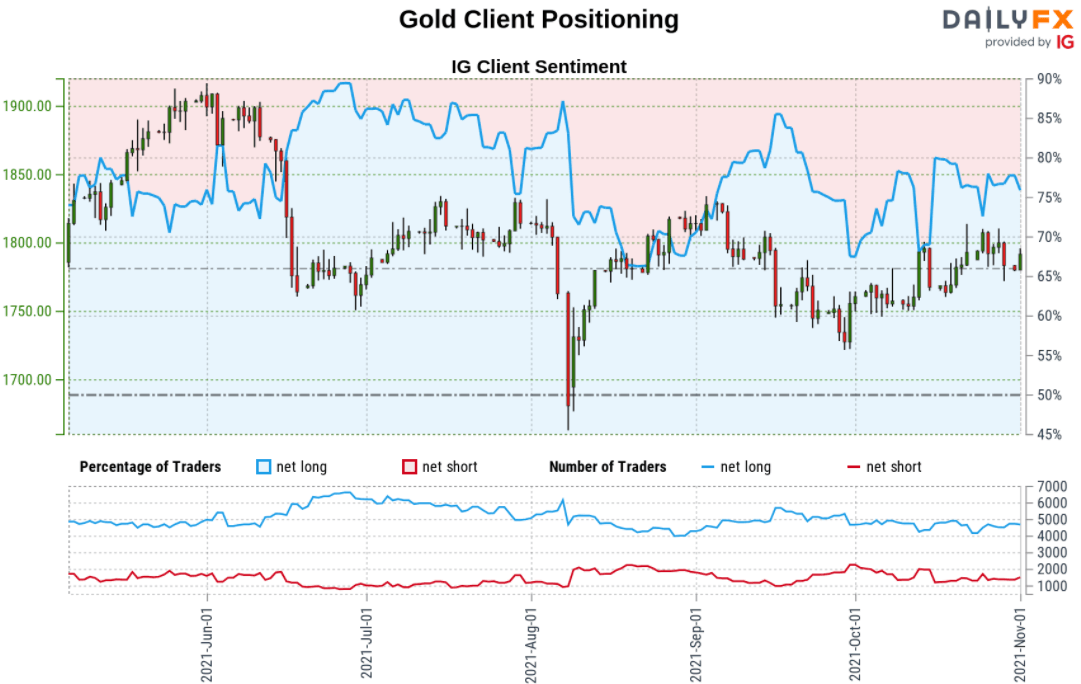
- A summary of IG Client Sentiment shows traders are net-long Gold- the ratio stands at +2.45 (70.98% of traders are long) – typically bearishreading
- Long positions are5.39% lower than yesterday and 3.46% lower from last week
- Short positions are34.91% higher than yesterday and 19.45% higher from last week
- We typically take a contrarian view to crowd sentiment, and the fact traders are net-long suggests Gold prices may continue to fall. Yet traders are less net-long than yesterday and compared with last week. Recent changes in sentiment warn that the current Gold price trend may soon reverse higher despite the fact traders remain net-long.
| Change in | Longs | Shorts | OI |
| Daily | 1% | -3% | -1% |
| Weekly | 2% | -8% | -2% |
---
Active Technical Setups
- Australian Dollar Outlook: Aussie Rallies to Key Zone- AUD/USD Levels
- Japanese Yen Outlook: USD/JPY Rips To Resistance- Tug-of-War into BoJ
- Canadian Dollar Outlook: USD/CAD Plunge into Support- Exhaustion Risk
- US Dollar Outlook: USD Snaps Support- DXY Breakdown Levels
- Sterling Outlook: GBP/USD Breakout Runs Resistance- Sink or Swim?
- Oil Price Outlook: Oil Rips 32% in Eight Weeks- WTI Breakout Levels
- Bitcoin Outlook: BTC/USD Soars into October- Breakout Levels
- Written by Michael Boutros, Technical Strategist with DailyFX
Follow Michael on Twitter @MBForex


