


Crude Oil Technical Forecast: WTI Near-term Trade Levels
- Crude Oil updated technical trade levels – Daily & Intraday Charts
- WTI rally stretches into key resistance objectives / constructive while above 75
- New to Oil Trading? Get started with this Free How to Trade Oil-Beginners Guide
Oil prices are attempting to mark a sixth-consecutive daily advance within a broader eight-week rally as the WTI breakout surges to fresh seven-year highs. While the broader outlook remains constructive, the immediate advance may be vulnerable in the days ahead as price stretches into confluent uptrend resistance. These are the updated targets and invalidation levels that matter on the oil price technical charts. Review my latest Strategy Webinar for an in-depth breakdown of this crude oil price setup and more.
Crude Oil Price Chart – WTI Daily
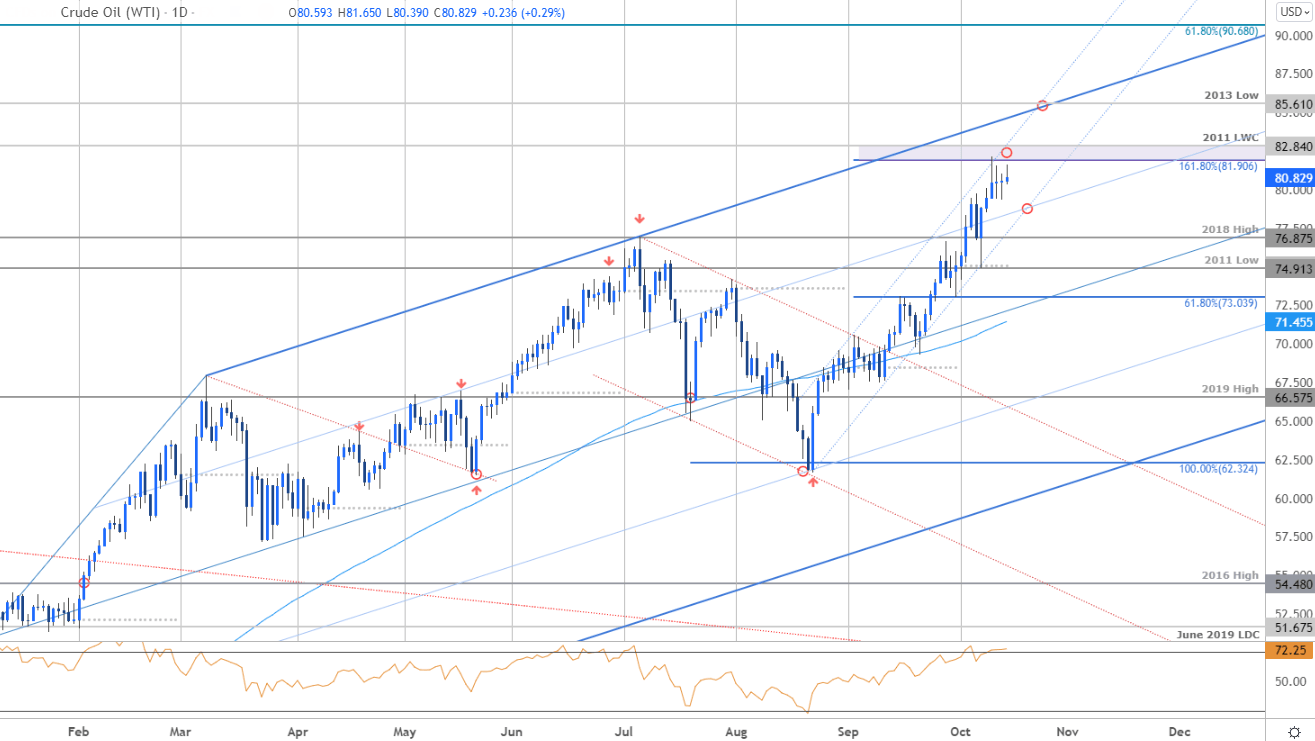
Chart Prepared by Michael Boutros, Technical Strategist; Crude Oil (WTI) on Tradingview
Technical Outlook: In last month’s Crude Oil Price Outlook we noted that WTI was, “testing initial resistance targets and keeps the focus weighted to the topside while above the monthly open. From a trading standpoint, look for downside exhaustion ahead of 70.42 IF price is heading higher on this stretch- ultimately the focus is on a breach /close above 74.91 to keep the long-bias viable towards the upper parallels.” Oil briefly registered an intraday low at 69.38 before rebounding sharply off the 100-day moving average / channel support with the subsequent rally closing the month just above the 2011 low at 74.91 – the October open registered at 75.09 and we’ll reserve this threshold as our broader bullish invalidation level.
Crude prices have now rallied a staggering 32% off the August lows with price stretching into confluent resistance this week at 81.90-82.84- a region defined by the 1.618% Fibonacci extension of the August advance and the 2011 low-week close. Risk for topside exhaustion into this zone as the trend matures. Daily support rests with the highlighted trendline confluence with a breach higher from here exposing longer-term trend resistance at the 2013 low around ~85.61 – look for a more significant reaction there IF reached.
Crude Oil Price Chart – WTI 120min
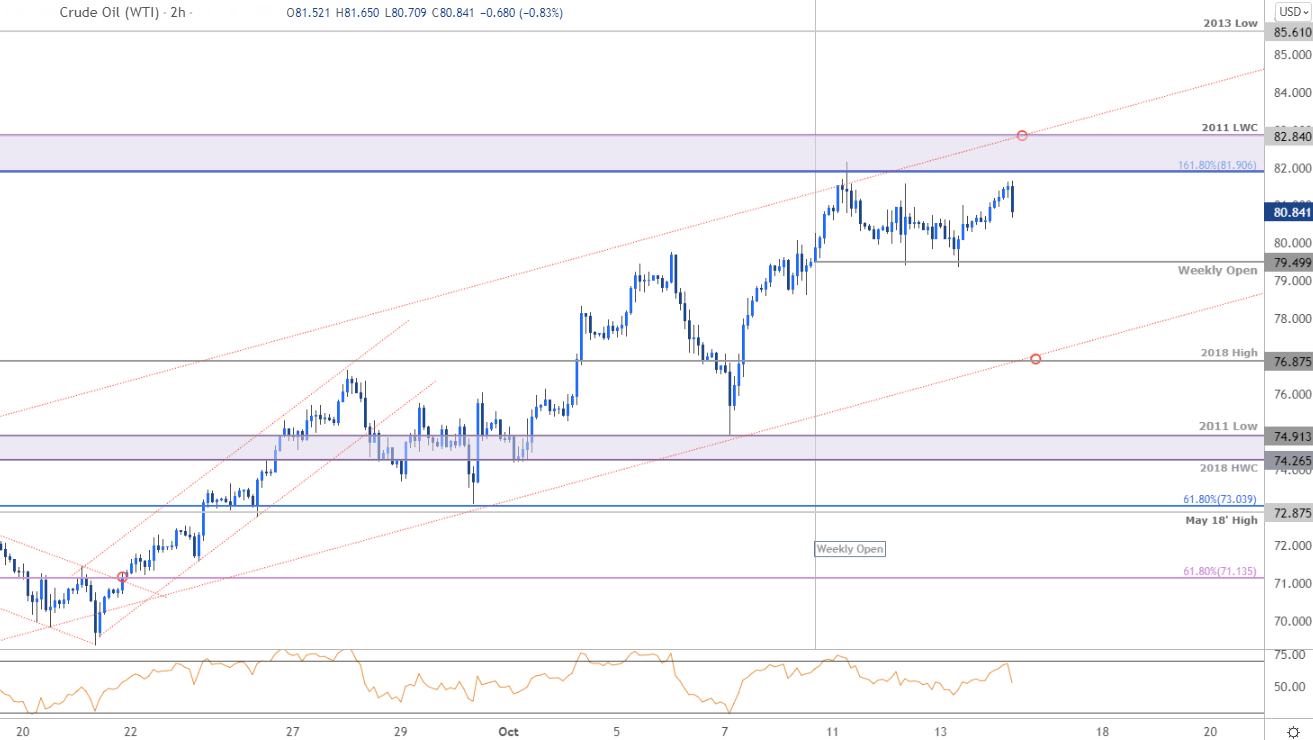
Notes: A closer look at Crude price action shows WTI carving out a well-defined weekly opening-range just below resistance at 81.90-82.84. Weekly-open support rests at 74.50 and is backed by the lower parallel / 2018 high at 76.87- look for downside exhaustion ahead of this zone IF price is indeed heading higher on this stretch. Ultimately a break below the monthly open / 2011 low / 2018 high-week close at 74.26-75.09 would be needed to shift the broader focus back to the downside in WTI.

Bottom line: The crude oil rally may be vulnerable near-term while below this technical resistance pivot. From a trading standpoint, a good zone to reduce long-exposure / raise protective stops - losses should be maintained within this channel for the long-bias to remain viable with a breach higher likely to fuel another accelerated rally towards key resistance at the upper parallels. Review my latest Crude Oil Weekly Price Outlook for a closer look at the longer-term technical trading levels.
For a complete breakdown of Michael’s trading strategy, review his Foundations of Technical Analysis series on Building a Trading Strategy
Crude Oil Trader Sentiment – WTI Price Chart
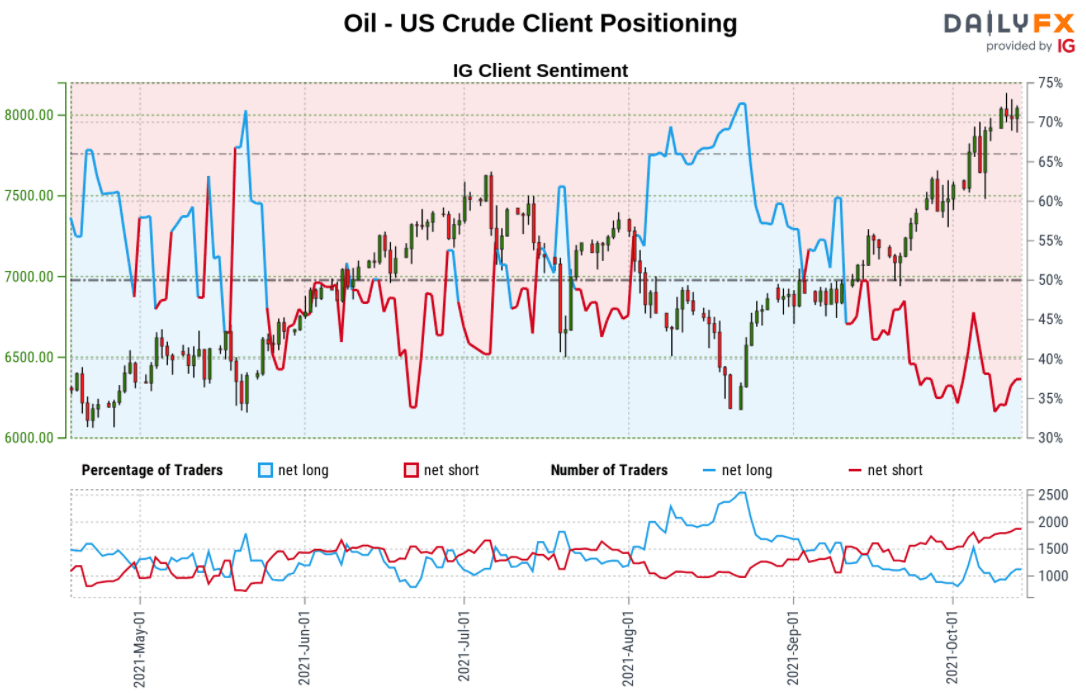
- A summary of IG Client Sentiment shows traders are net-short crude oil - the ratio stands at -1.59 (38.56% of traders are long) – typically bullish reading
- Long positions are 7.71% higher than yesterday and 0.33% higher from last week
- Short positions are5.16% higher than yesterday and 27.33% higher from last week
- We typically take a contrarian view to crowd sentiment, and the fact traders are net-short suggests Oil - US Crude prices may continue to rise. Trader are less net-short than yesterday but more net-short from last week. The combination of current retail positioning and recent changes gives us a further mixed Oil - US Crude trading bias from a sentiment standpoint.
| Change in | Longs | Shorts | OI |
| Daily | 3% | -7% | 1% |
| Weekly | 31% | -38% | 7% |
---
Active Technical Setups
- Canadian Dollar Outlook: USD/CAD Coils at Key Support- Breakout Levels
- Gold Price Outlook: Gold Breakout Potential- XAU/USD Opening-Range Setup
- Bitcoin Outlook: BTC/USD Soars into October- Breakout Levels
- Sterling Outlook: GBP/USD Plunge Breaks Monthly Range- Support in View
- Oil Price Outlook: Crude Breakout Eyes August Highs- WTI Technicals
- New Zealand Dollar Outlook: NZD/USD Grinds at Resistance- Kiwi Levels
- US Dollar Outlook: DXY Sets Breakout Stage- USD Levels

--- Written by Michael Boutros, Technical Strategist with DailyFX
Follow Michael on Twitter @MBForex


