


Gold Technical Price Outlook: XAU/USD Near-term Trade Levels
- Gold price updated technical trade levels – Daily & Intraday Charts
- XAU/USD carves monthly range above uptrend support at ~1744- key near-term resistance 1795
- New to Gold Trading? Get started with this Free How to Trade Gold -Beginners Guide
Gold prices rallied more than 3.4% off the September lows with XAU/USD trading at 1755 into the open of trade this week. We’re on the lookout for possible exhaustion on this pullback with the immediate focus on a breakout of the monthly opening-range. These are the updated targets and invalidation levels that matter on the XAU/USD technical charts. Review my latest Strategy Webinar for an in-depth breakdown of this gold technical setup and more.
Gold Price Chart - XAU/USD Daily
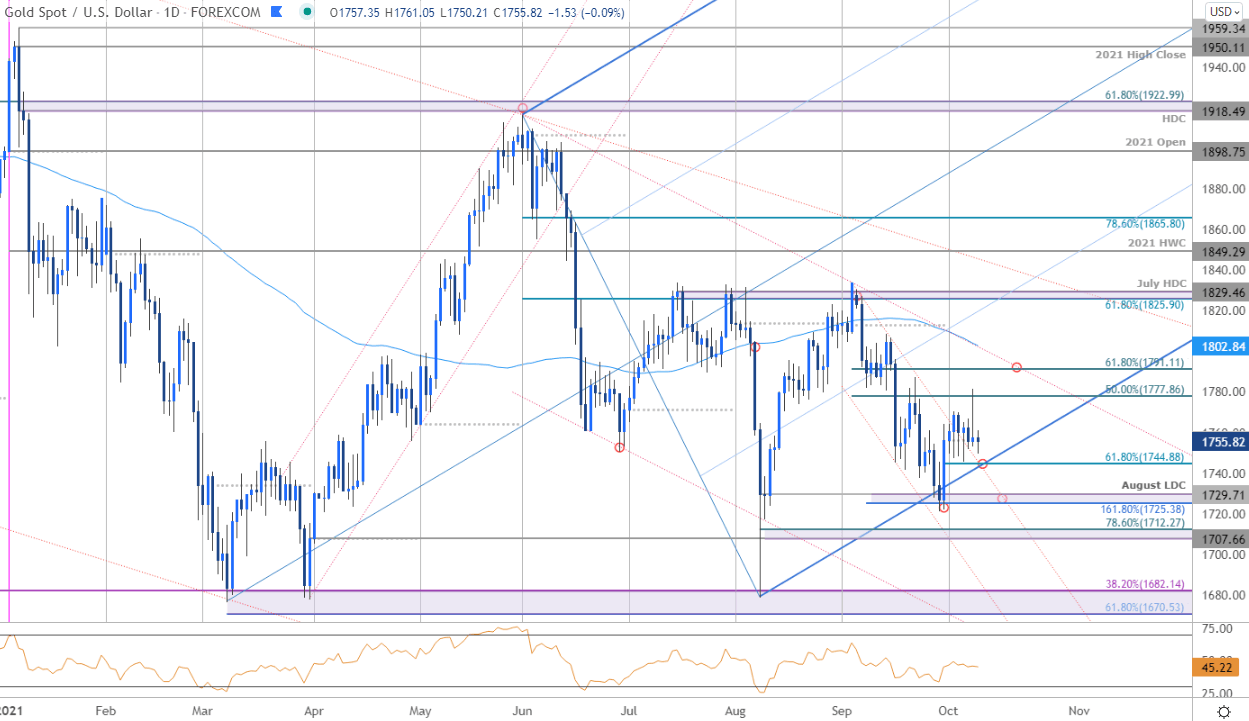
Chart Prepared by Michael Boutros, Technical Strategist; Gold on Tradingview
Technical Outlook: In my last Gold Price Outlook we warned that XAU/USD was, “trading just above confluent support at 1729/38 – from a trading standpoint, a good zone to reduce short-exposure / lower protective stops. Losses should be limited this support zone IF price is indeed heading higher with a breach / close above 1774 needed to clear the way for a larger rally.” The sell-off went even deeper to register a low at 1721 before being caught by the 1.618% extension of the September decline / August low-day close at 1725/29. A substantial rebound ensued with Gold tipping the 50% retracement of the September decline before pulling back– the October opening-range is set with the focus on a breakout of 1744 – 1777.
Gold Price Chart - XAU/USD 120min
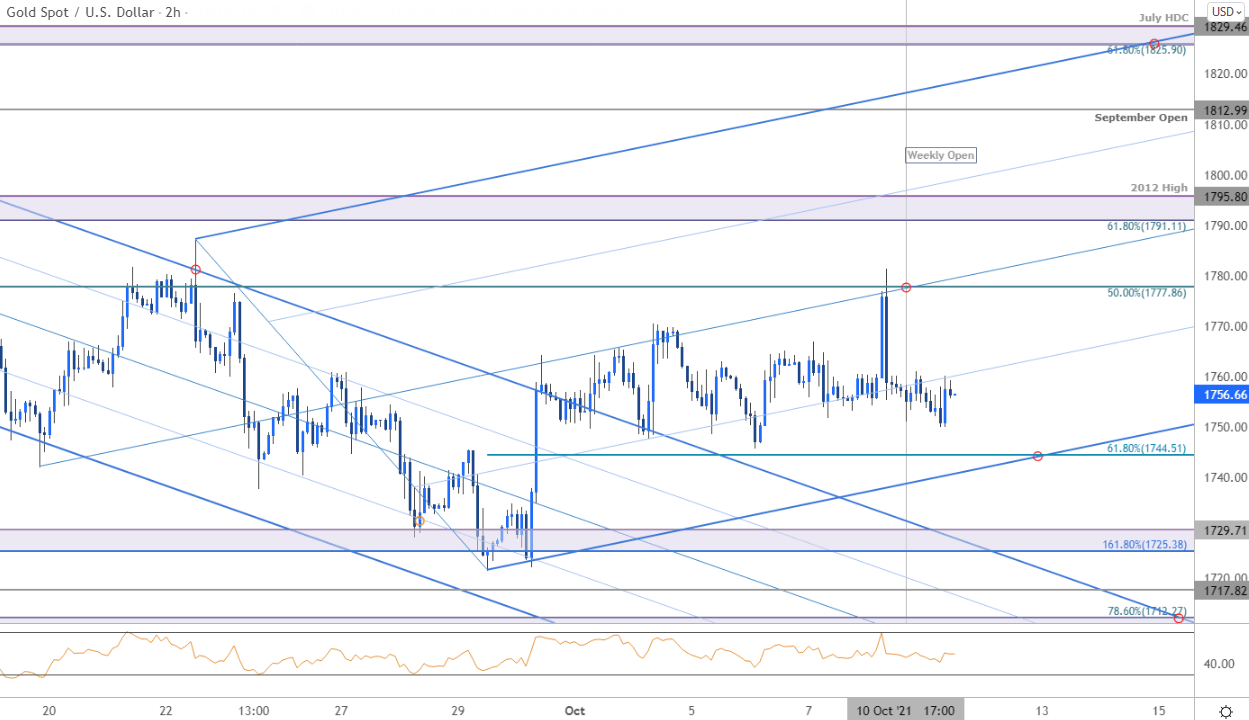
Notes: A closer look at Gold price action shows XAU/USD trading within the confines of an ascending pitchfork formation extending off the September lows. Note that the lower parallel converges on the 61.8% Fibonacci retracement of the September decline near 1744 later this week – a break / close below this threshold would threaten another run on support targets at 1725/29, 1717 and 1707/12. Initial resistance steady at 1777 with a topside breach / close above the 61.8% retracement / 2012 high at 1791/95 needed validate a larger price reversal in Gold.

Bottom line: Gold made a strong defense of support into the close of September with the October opening-range set just above uptrend support- we’re on breakout watch. From a trading standpoint, look for downside exhaustion head of the lower parallel IF price is indeed heading higher with a breach above 1791/95 needed to fuel the next leg-up in price. Stay nimble here- Ultimately weakness beyond 1707 would likely witness another bout of accelerated losses for the yellow metal. Stay tuned! Review my latest Gold Weekly Price Outlook for a closer look at the longer-term XAU/USD technical trading levels.
For a complete breakdown of Michael’s trading strategy, review his Foundations of Technical Analysis series on Building a Trading Strategy
Gold Trader Sentiment – XAU/USD Price Chart

- A summary of IG Client Sentiment shows traders are net-long Gold- the ratio stands at +3.32 (76.84% of traders are long) – typically bearishreading
- Long positions are2.85% higher than yesterday and 1.07% lower from last week
- Short positions are8.20% higher than yesterday and 27.08% lower from last week
- We typically take a contrarian view to crowd sentiment, and the fact traders are net-long suggests Gold prices may continue to fall. Traders are less net-long than yesterday but more net-long from last week. The combination of current positioning and recent changes gives us a further mixed Gold trading bias from a sentiment standpoint.
| Change in | Longs | Shorts | OI |
| Daily | -2% | 2% | 0% |
| Weekly | -1% | 0% | -1% |
---
Active Technical Setups
- Bitcoin Outlook: BTC/USD Soars into October- Breakout Levels
- Canadian Dollar Outlook: USD/CAD Snaps Five-Days Down- Reversal Risk
- Sterling Outlook: GBP/USD Plunge Breaks Monthly Range- Support in View
- Oil Price Outlook: Crude Breakout Eyes August Highs- WTI Technicals
- New Zealand Dollar Outlook: NZD/USD Grinds at Resistance- Kiwi Levels
- US Dollar Outlook: DXY Sets Breakout Stage- USD Levels
- Written by Michael Boutros, Technical Strategist with DailyFX
Follow Michael on Twitter @MBForex


