


Canadian Dollar Technical Price Outlook: Near-term Trade Levels
- Canadian Dollar updated technical trade levels – Daily & Intraday Charts
- USD/CAD breakdown stalls into technical support- weekly opening-range in focus
- Key near-term support 1.2422/40 - Resistance 1.2525, 1.2589 (key)
The Canadian Dollar surged nearly 2% against the US Dollar since the start of the month with a three-week decline in USD/CAD taking price into a major support hurdle. We’re on the lookout for possible downside exhaustion into this threshold as Loonie sets a well-defined weekly range setup just above. These are the updated targets and invalidation levels that matter on the USD/CAD price charts heading into key US Inflation data tomorrow. Review my latest Strategy Webinar for an in-depth breakdown of this Loonie technical setup and more.
Canadian Dollar Price Chart – USD/CAD Daily
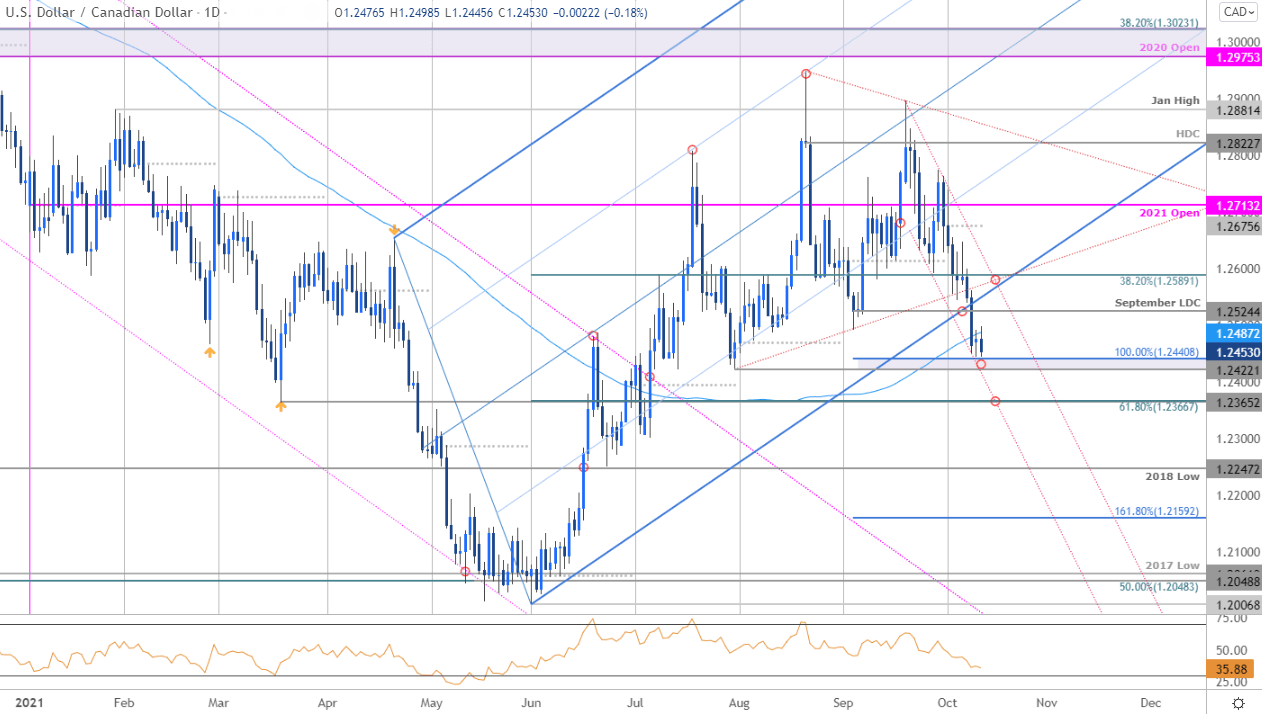
Chart Prepared by Michael Boutros, Technical Strategist; USD/CAD on Tradingview
Technical Outlook: In my last Canadian Dollar Price Outlook we noted that USD/CAD was trading, “within the confines of a broad multi-month price consolidation and we’ll be looking for the breakout to offer guidance as we head into October trade.” A downside break of the lower bounds on October 7th fueled a decline of more than 1.2% with the sell-off settling just above confluence support at the late-July lows / 100% extension of the August decline at 1.2422/40 – looking for possible price inflection off this threshold in the days ahead.
Canadian Dollar Price Chart – USD/CAD 120min
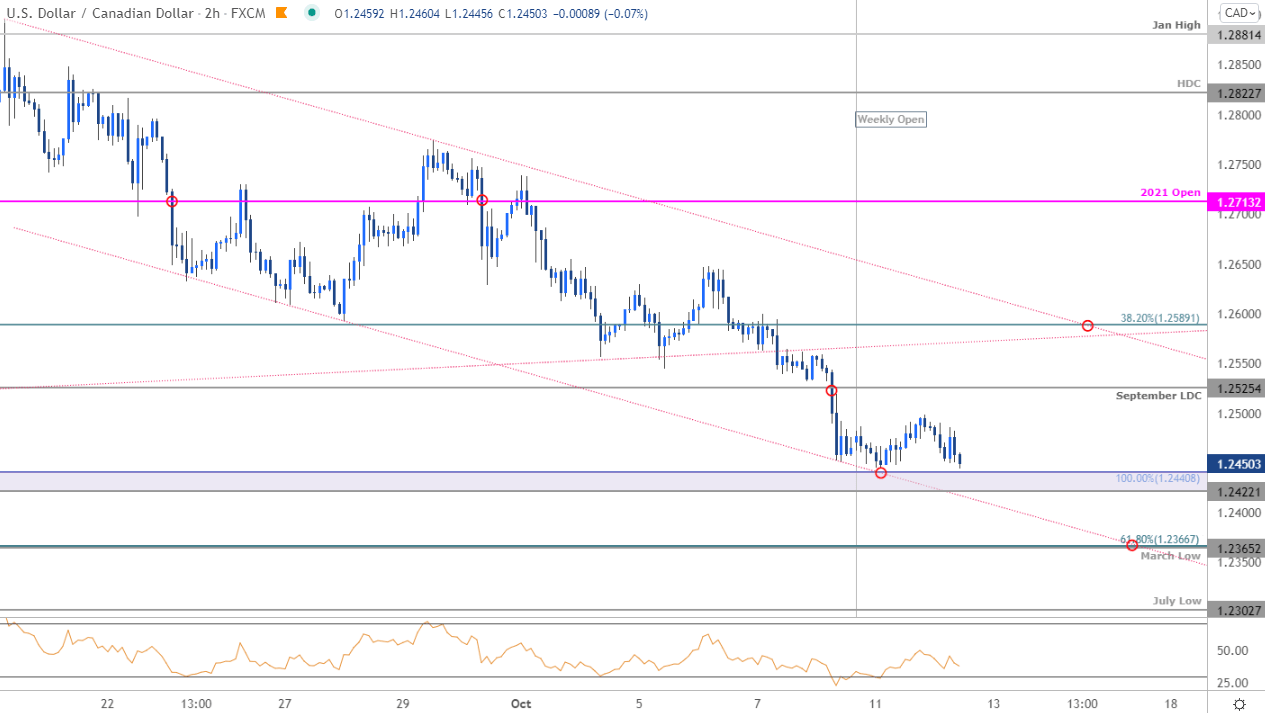
Notes: A closer look at Loonie price action shows USD/CAD trading within the confines of a descending channel formation with the lower parallel further highlighting near-term support at 1.2422/40. Initial resistance eyed at the September low-day close at 1.2525 with bearish invalidation now lowered to the upper parallel / 38.2% Fibonacci retracement at 1.2589 – a breach / close above this threshold is needed to suggest a more significant near-term low is in place. A break lower from here would threaten another bout of losses towards subsequent support objectives at the March low / 61.8% retracement at 1.2365/66 and the July lows at 1.2302.

Bottom line: USD/CAD has set the weekly opening-rang just above key near-term support – look to the breakout for guidance with the bears vulnerable while above. From a trading standpoint, a good zone to reduce short-exposure / lower protective stops - look for a reaction into the upper parallel IF reached with a close above 1.2589 needed to shift the focus back toward the yearly open at 1.2713. A pivot below this support zone would threaten resumption of the broader downtrend towards fresh three-month lows. Review my latest Canadian Dollar Weekly Price Outlook for a closer look at the longer-term USD/CAD technical trade levels.
For a complete breakdown of Michael’s trading strategy, review his Foundations of Technical Analysis series on Building a Trading Strategy
Canadian Dollar Trader Sentiment – USD/CAD Price Chart

- A summary of IG Client Sentiment shows traders are net-long USD/CAD - the ratio stands at +3.16 (75.94% of traders are long) – typically bearish reading
- Long positions are5.20% higher than yesterday and 16.63% higher from last week
- Short positions are 6.34% lower than yesterday and 20.75% lower from last week
- We typically take a contrarian view to crowd sentiment, and the fact traders are net-long suggests USD/CAD prices may continue to fall. Traders are further net-long than yesterday and last week, and the combination of current positioning and recent changes gives us a stronger USD/CAD-bearish contrarian trading bias from a sentiment standpoint.
| Change in | Longs | Shorts | OI |
| Daily | -2% | 7% | 5% |
| Weekly | -30% | 38% | 13% |
---
Key US / Canada Data Releases
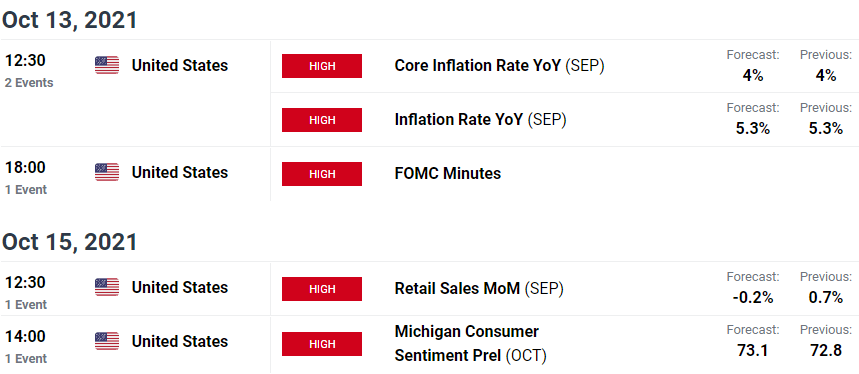
Economic Calendar - latest economic developments and upcoming event risk.
Active Technical Setups
- Gold Price Outlook: Gold Breakout Potential- XAU/USD Opening-Range Setup
- Bitcoin Outlook: BTC/USD Soars into October- Breakout Levels
- Sterling Outlook: GBP/USD Plunge Breaks Monthly Range- Support in View
- Oil Price Outlook: Crude Breakout Eyes August Highs- WTI Technicals
- New Zealand Dollar Outlook: NZD/USD Grinds at Resistance- Kiwi Levels
- US Dollar Outlook: DXY Sets Breakout Stage- USD Levels
- Written by Michael Boutros, Currency Strategist with DailyFX
Follow Michael on Twitter @MBForex


