


US Dollar Technical Price Outlook: DXY Near-term Trade Levels
- US Dollar technical updated technical trade levels – Daily & Intraday Charts
- USD carves September range above uptrend support – FOMC on tap next week
- Resistance 92.83- 93.18(key) - Support eyed at 92.30, constructive above 92.11
The US Dollar Index is little changed from the start of the week, with DXY trading in a 0.6% range amid the kneejerk reaction to the US Core Inflation read yesterday. The weekly and monthly opening-range is set just above multi-month uptrend support and the battlelines are drawn heading into the FOMC rate decision next week. These are the updated technical targets and invalidation levels that matter on the US Dollar Index price chart. Review my latest Strategy Webinar for an in-depth breakdown of this DXY technical setup and more.
US Dollar Index Price Chart – DXY Daily

Chart Prepared by Michael Boutros, Technical Strategist; US Dollar Index on Tradingview
Technical Outlook: The US Dollar Index plunged 1.9% off the August highs before rebounding just ahead of uptrend support in early September. A well-defined monthly opening-range has been carved out just below the 50% retracement of the decline and the focus is on the breakout for guidance with the broader outlook constructive while above the lower parallel / 38.2% Fibonacci retracement of the May rally at 92.11.
US Dollar Index Price Chart – DXY 120min

Notes: A closer look at DXY price action shows the dollar breaking out of a near-term descending channel formation last week the index setting a well-defined range just above the 61.8% retracement of the advance at 92.30. Monthly-open resistance at 92.66 with a breach of the highs exposing 93.04 and the median-line / 8/27 sing highs at 93.18- look for a larger reaction there IF reached.

Bottom line: The US Dollar pullback has set the September opening-rang just above uptrend support. From a trading standpoint, look to the break for guidance – be on the lookout for downside exhaustion ahead of the 92-handle IF price breaks lower with a close above the median needed to fuel another run at key resistance at the November / August high-day closes at 93.40/45. Review my latest US Dollar Weekly Price Outlook for an in-depth look at the longer-term DXY technical trade levels.
For a complete breakdown of Michael’s trading strategy, review his Foundations of Technical Analysis series on Building a Trading Strategy
---
Key US Economic Data Releases
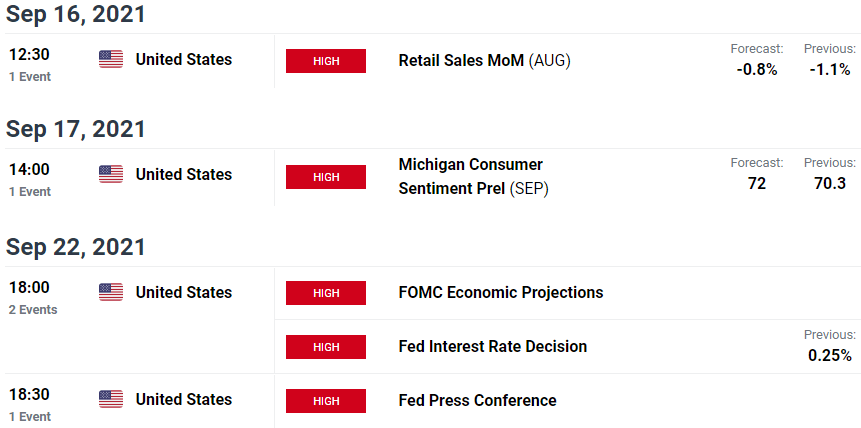
Economic Calendar - latest economic developments and upcoming event risk.
Active Technical Setups
- Gold Price Outlook: Gold Plunge Searches for Support- XAU/USD Levels
- Bitcoin Outlook: BTC/USD Plunges to Trend Support- Battle Lines Drawn
- Canadian Dollar Outlook: USD/CAD Blow-off to Offer Reset- Loonie Levels
- Australian Dollar Outlook: Aussie Reversal Threat- AUD/USD Levels
- Euro Price Outlook: EUR/USD Surge to Resistance on NFP- ECB on Deck
- Sterling Outlook: GBP/USD Rally Eyes Breakout Resistance ahead of NFP
- Written by Michael Boutros, Currency Strategist with DailyFX
Follow Michael on Twitter @MBForex


