


Sterling Technical Price Outlook: GBP/USD Trade Levels
- Sterling technical trade level update – Daily & Intraday Charts
- GBP/USD reversal off trend resistance breaks September range lows- risk for deeper correction
- Key support 1.3625/46- Resistance 1.3735, 1.3854- bearish invalidation 1.3844
The British Pound is poised to close a third consecutive daily decline against the US Dollar with GBP/USD down more than 1.9% off the monthly high. The decline marks a break of the monthly range with the sell-off now probing a critical support pivot- looking for a reaction here in the days ahead with the FOMC interest rate decision on tap. These are the updated targets and invalidation levels that matter on the GBP/USD price charts. Review my latest Weekly Strategy Webinar for an in-depth breakdown of this Sterling technical setup and more.
Sterling Price Chart – GBP/USD Daily
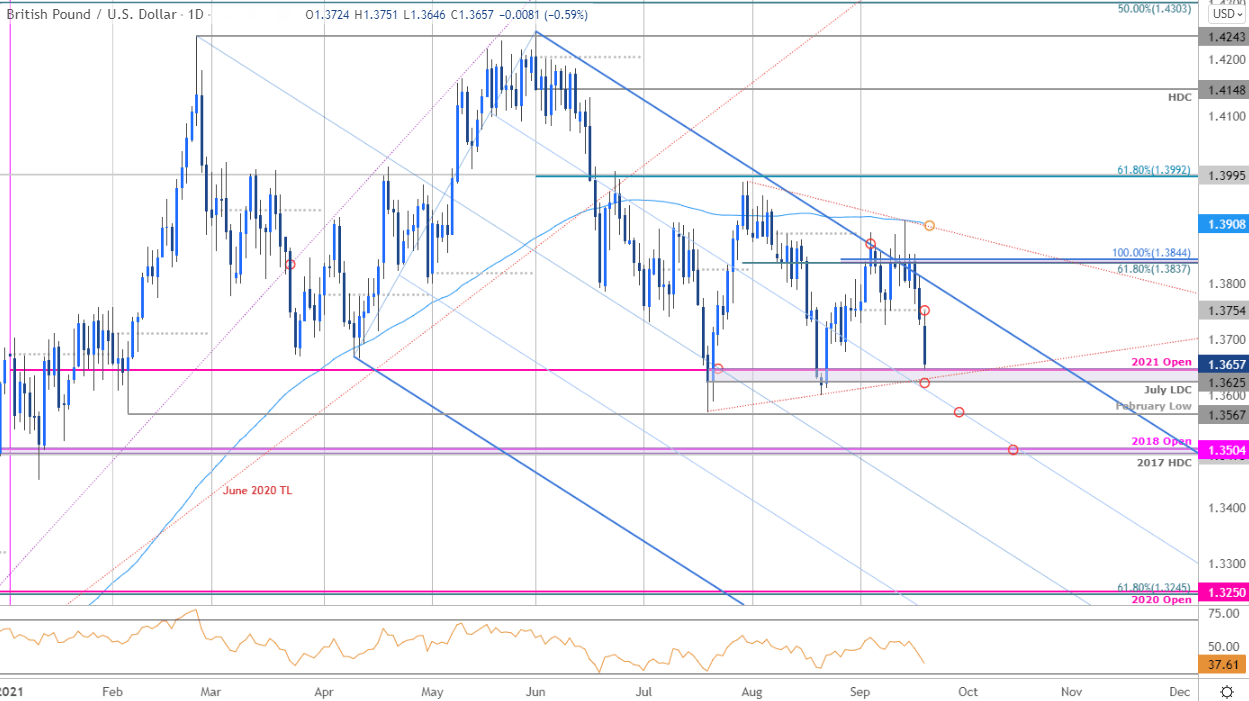
Chart Prepared by Michael Boutros, Technical Strategist; GBP/USD on Tradingview
Technical Outlook: In my last Sterling Outlook we noted that that rally was approaching longer-term downtrend resistance – “From at trading standpoint, a good zone to reduce long-exposure / raise protective stops- be on the lookout for topside exhaustion / possible inflection into the upper parallel for guidance early in the month with a close above 1.3890 ultimately needed to keep the long-bias viable.” Sterling registered an intraday high at 1.3913 last week before reversing sharply lower with a break of the September opening-range lows shifting the focus towards a critical support confluence just lower. Note that the British Pound has been in consolidation above the July lows with price now approaching key support at the July low-day close / 2021 yearly open at 1.3625/46- look for a reaction there IF reached with a break / close below needed to keep the short-bias viable in the days ahead.
Sterling Price Chart – GBP/USD 120min
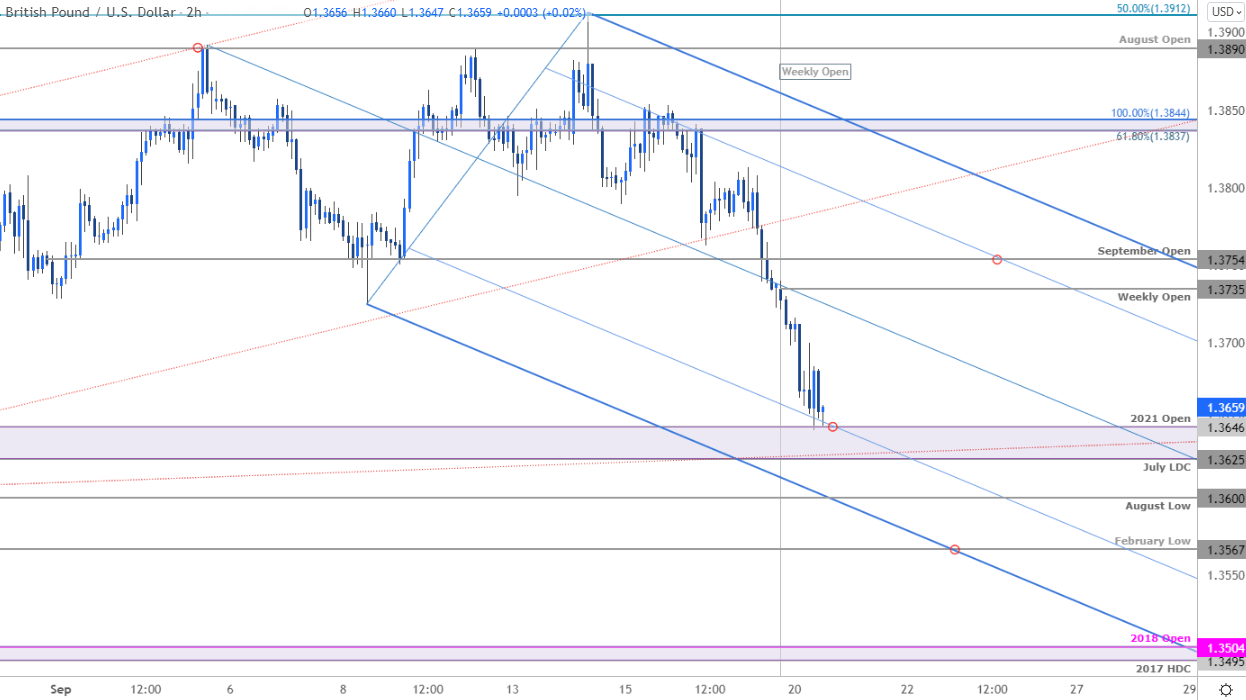
Notes: A closer look at Sterling price action shows GBP/USD trading within the confines of a descending pitchfork formation extending off the Monthly highs. The 61.8% parallel now converges on the 1.3625/46 support zone and further highlights its technical significance. Weekly open resistance stands at 1.3735 backed by the September open at 1.3754 – areas of interest for possible topside exhaustion IF price is heading lower. Near-term bearish invalidation steady at 1.3844. A break below support here would keep the focus on the August low at the 1.36-handle and the February low at 1.3567– weakness beyond this threshold would risk another bout of accelerated losses for Sterling with such a scenario threatening a run on the 2017 high-day close / 2018 yearly open at 1.3495-1.3504.

Bottom line: Sterling has broken the monthly opening-range with the decline now testing key support into the objective yearly open – we’re looking for a reaction here. From a trading standpoint, a good zone to reduce short-exposure / lower protective stops – look for topside exhaustion ahead of the monthly open IF price is heading lower with a break / close below 1.3625 needed to suggest a larger correction is underway. Review my latest British Pound Weekly Price Outlook for a closer look at the longer-term GBP/USD technical trade levels.
For a complete breakdown of Michael’s trading strategy, review his Foundations of Technical Analysis series on Building a Trading Strategy
Sterling Trader Sentiment – GBP/USD Price Chart
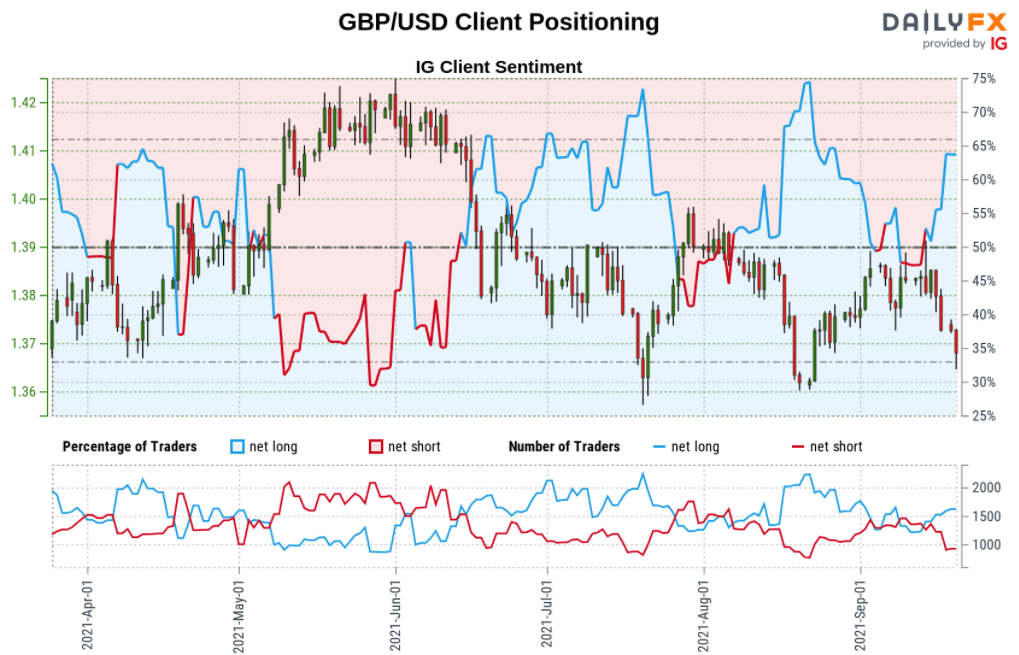
- A summary of IG Client Sentiment shows shows traders are net-long GBP/USD - the ratio stands at +2.07 (67.38% of traders are long) – typically bearish reading
- Long positions are 14.09% higher than yesterday and 29.70% higher from last week
- Short positions are 2.15% lower than yesterday and 37.22% lower from last week
- • We typically take a contrarian view to crowd sentiment, and the fact traders are net-long suggests GBP/USD prices may continue to fall. Traders are further net-long than yesterday and last week, and the combination of current positioning and recent changes gives us a stronger GBP/USD-bearish contrarian trading bias from sentiment standpoint.
| Change in | Longs | Shorts | OI |
| Daily | 3% | -7% | -3% |
| Weekly | 4% | -10% | -5% |
---
UK / US Economic Calendar

Economic Calendar - latest economic developments and upcoming event risk.
Active Technical Setups
- Oil Price Outlook: Crude Breakout Eyes August Highs- WTI Technicals
- Canadian Dollar Outlook: USD/CAD Breakout Imminent- Loonie Levels
- New Zealand Dollar Outlook: NZD/USD Grinds at Resistance- Kiwi Levels
- US Dollar Outlook: DXY Sets Breakout Stage- USD Levels
- Gold Price Outlook: Gold Plunge Searches for Support- XAU/USD Levels
- Bitcoin Outlook: BTC/USD Plunges to Trend Support- Battle Lines Drawn
- Australian Dollar Outlook: Aussie Reversal Threat- AUD/USD Levels
- Euro Price Outlook: EUR/USD Surge to Resistance on NFP- ECB on Deck
- Written by Michael Boutros, Currency Strategist with DailyFX
Follow Michael on Twitter @MBForex


