


Sterling Technical Price Outlook: GBP/USD Weekly Trade Levels
- Sterling technical trade level update – Weekly Chart
- GBP/USD carves September opening-range just below trend resistance
- Support 1.3754, 1.3630- Resistance 1.3898, 1.3997 (key)
The British Pound is virtually unchanged against the US Dollar with GBP/USD paring early-week declines to trade back into the weekly open. The rally takes Cable back into trend resistance with the September range setting up just below- we’re on breakout watch in the weeks ahead. These are the updated targets and invalidation levels that matter on the GBP/USD weekly chart. Review my latest Strategy Webinar for an in-depth breakdown of this Sterling technical setup and more.
Sterling Price Chart - GBP/USD Weekly
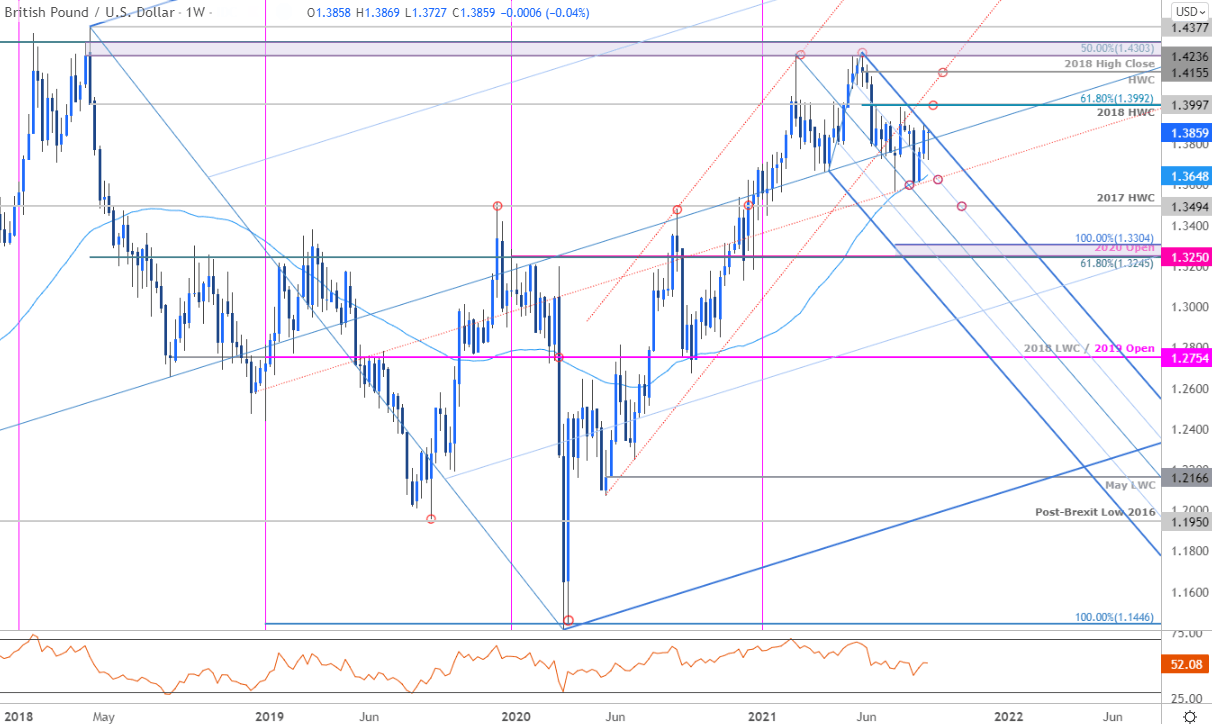
Chart Prepared by Michael Boutros, Technical Strategist; GBP/USD on Tradingview
Notes: In last month’s Sterling Weekly Price Outlook we warned that GBP/USD was approaching support near 1.3675 while noting that, “From a trading standpoint, a good zone to reduce short-exposure / lower protective stops – rallies should be capped by the 1.39-handle IF price is heading lower…” Price registered the August low at 1.3602 before mounting a rally of more than 2% with Cable registering a high at 1.3892 into the September open before pulling back. A defense of monthly open support at 1.3754 puts GBP/USD back at this key resistance threshold into the close of the week- the battle lines are drawn.
A topside breach / close above pitchfork resistance is needed to suggest a larger breakout is underway towards the key weekly objectives at the 61.8% % Fibonacci retracement of the May decline / 2018 high-week close at 1.3992/97and this year’s high-week close at 1.4155- areas of interest for possible exhaustion IF reached. Weekly support rests at the highlighted trendline confluence near the 52-week moving average at 1.3630/48- a close below this threshold would be needed to mark resumption with such a scenario threatening a sharper decline towards key support objectives at the 2017 high-week close at 1.3494 and 1.3245-1.33.
For a complete breakdown of Michael’s trading strategy, review his Foundations of Technical Analysis series on Building a Trading Strategy
Bottom Line: Sterling has rallied back into downtrend resistance with the September opening-range set just below. From a trading standpoint, a good region to reduce long-exposure / raise protective stops –Look to the breakout for guidance with the recent rally vulnerable while below this slope. Stay nimble into the close on Friday - key inflation data from the UK & US on tap next week. Review my latest Sterling Price Outlook for a closer look at the near-term GBP/USD technical trade levels.

Sterling Trader Sentiment - GBP/USD Price Chart

- A summary of IG Client Sentiment shows traders are net-long GBP/USD - the ratio stands at +1.04 (50.87% of traders are long) – neutral reading
- Long positions are 16.72% lower than yesterday and 11.29% lower from last week
- Short positions are 8.08% higher than yesterday and 5.09% higher from last week
- We typically take a contrarian view to crowd sentiment, and the fact traders are net-long suggests GBP/USD prices may continue to fall. Yet traders are less net-long than yesterday and compared with last week. Recent changes in sentiment warn that the current GBP/USD price trend may soon reverse higher despite the fact traders remain net-long.
| Change in | Longs | Shorts | OI |
| Daily | -6% | -6% | -6% |
| Weekly | -15% | 15% | -4% |
---
UK / US Economic Calendar
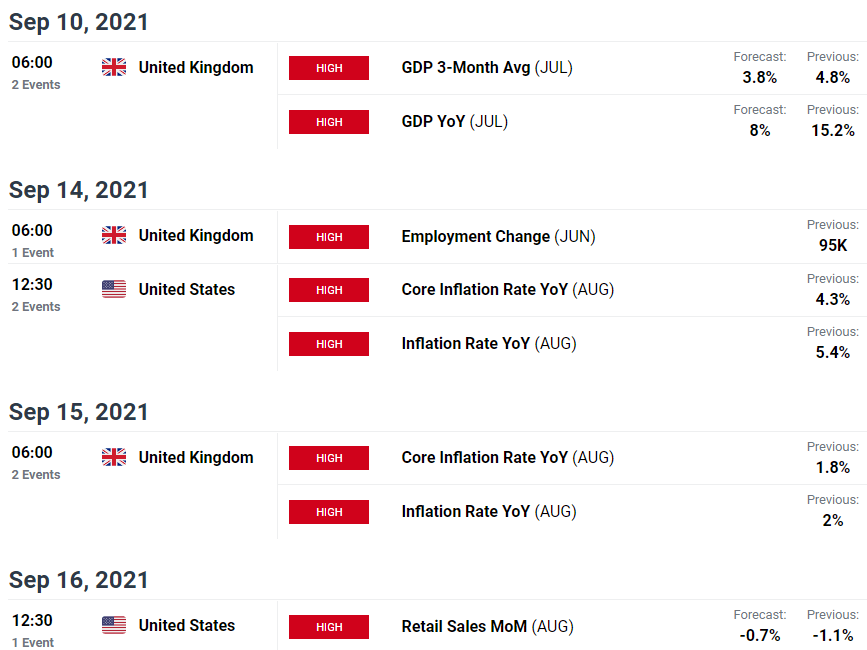
Economic Calendar - latest economic developments and upcoming event risk.
Previous Weekly Technical Charts
- Crude Oil (WTI)
- Gold (XAU/USD)
- Euro (EUR/USD)
- US Dollar Index (DXY)
- New Zealand Dollar (NZD/USD)
- Australian Dollar (AUD/USD)
- Canadian Dollar (USD/CAD)

--- Written by Michael Boutros, Technical Currency Strategist with DailyFX
Follow Michael on Twitter @MBForex


