


Bitcoin Technical Price Outlook: BTC/USD Trade Levels
- Bitcoin updated technical trade level– Daily & Intraday Charts
- BTC/USD breakout rallies to multi-month highs- Resistance 57128, 62986- Key support 47004.
- What is Bitcoin? Understand Bitcoin as a Cryptocurrency
Bitcoin prices surged more than 13% this week on the tail of a 11.6% rally last week with BTC/USD trading near 5-month highs. While the breakout does keep the broader outlook constructive, the immediate advance may be vulnerable in the days ahead as price approaches technical resistance just higher. These are the updated targets and invalidation levels that matter on the BTC/USD technical price charts. Review my latest Strategy Webinar for an in-depth breakdown of this Bitcoin setup and more.
Bitcoin Price Chart – BTC/USD Daily
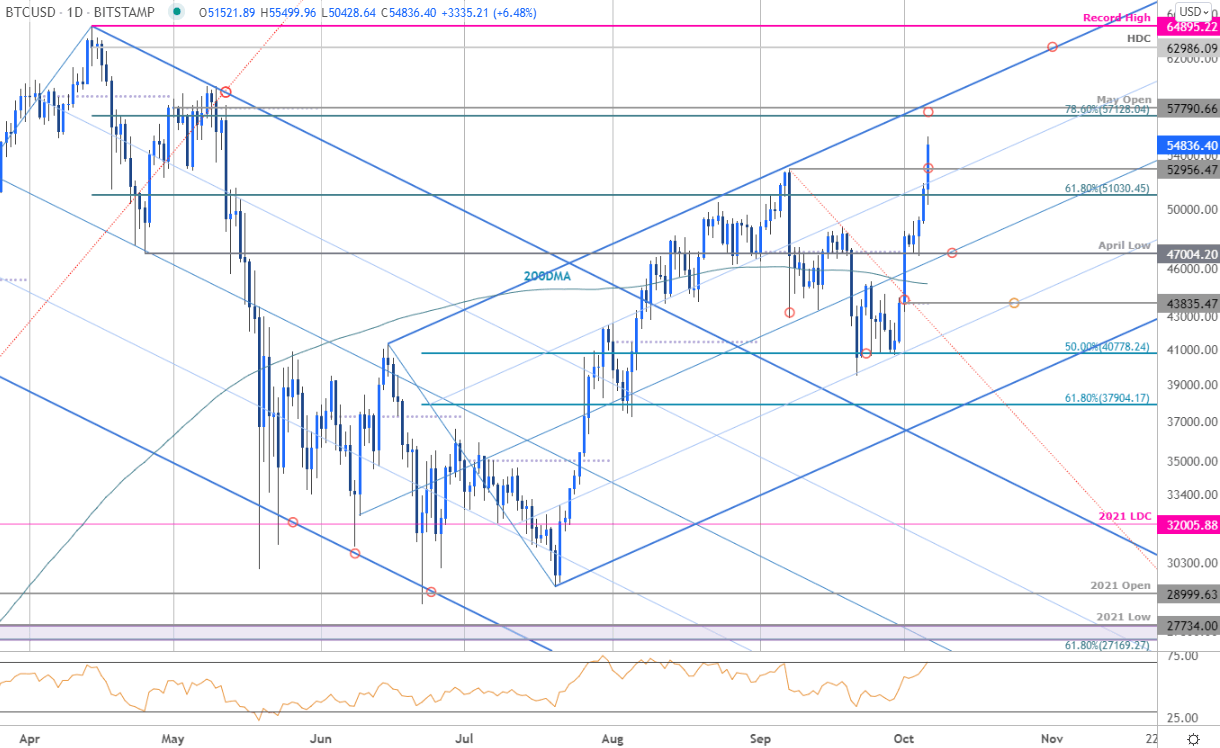
Chart Prepared by Michael Boutros (log scale), Technical Strategist; Bitcoin on Tradingview
Technical Outlook: In my last Bitcoin Price Outlook we warned that the BTC/USD sell-off had responded to near-term downtrend support - “A new low has registered- we’re now on the lookout for downside exhaustion / low in price.” We got one! The lows at 39573 held into the close of September with a massive breakout into the October open rallying more than 40% off the recent low- that advance has now extended into four-month highs.
Initial resistance is eyed at the 78.6% Fibonacci retracement of the April decline / May open at 57128/790- a breach / daily close above is needed to keep the immediate rally viable with such a scenario exposing subsequent resistance objectives at the upper parallel / yearly high-day close at 62986 and the record highs at 64895.
Bitcoin Price Chart – BTC/USD 240min
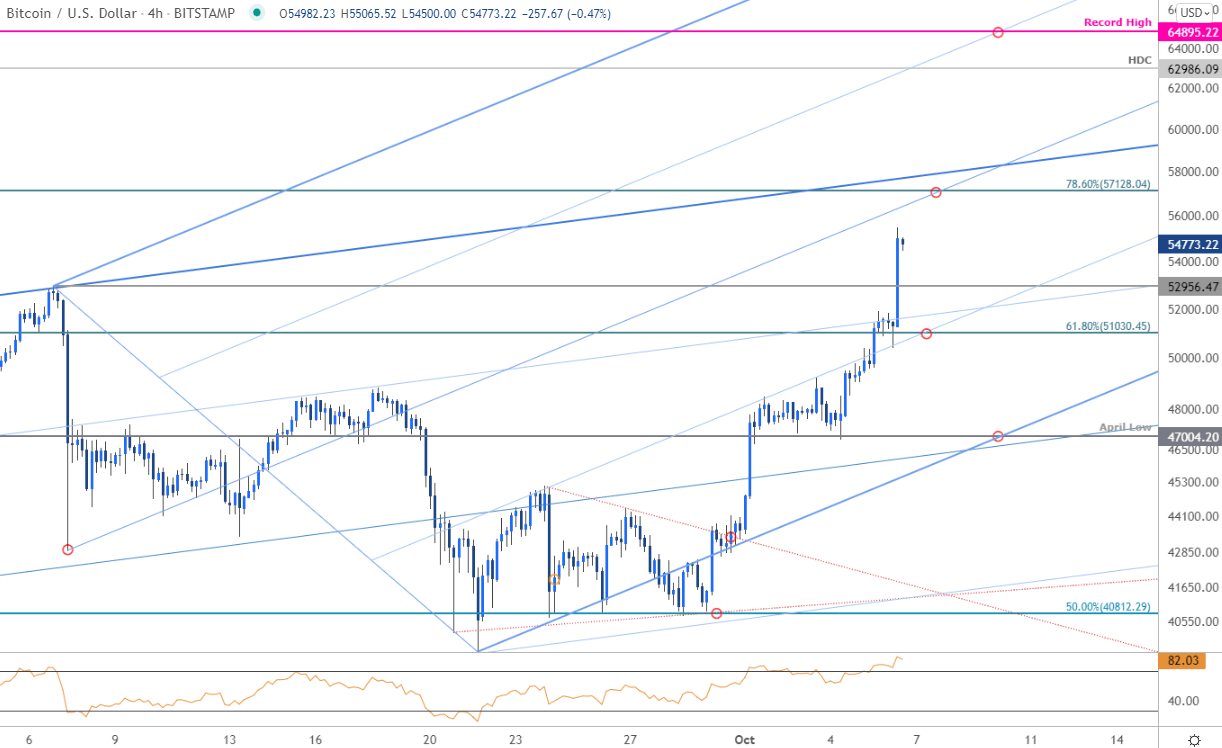
Notes: A closer look at Bitcoin price action shows BTC/USD trading within the confines of a proposed ascending pitchfork formation extending off the September lows. It’s not the cleanest setup but the slope has defined the inflections rather well on this advance. In any event, initial support now back at 51030 with near-term bullish invalidation now raised to the April lows at 47004.

Bottom line: The Bitcoin breakout is now approaching initial resistance targets – risk for inflection just higher into the median-line. From a trading standpoint, look to reduce long-exposure / raise protective stops on a stretch towards 57128- losses should be limited to the lower parallel / 47004 on pullbacks IF price is heading higher with a topside breach exposing targets into the record highs.
For a complete breakdown of Michael’s trading strategy, review his Foundations of Technical Analysis series on Building a Trading Strategy
---
Active Technical Setups
- Canadian Dollar Outlook: USD/CAD Snaps Five-Days Down- Reversal Risk
- Gold Price Outlook: Gold Drops into Pivotal Support- XAU/USD Levels
- Sterling Outlook: GBP/USD Plunge Breaks Monthly Range- Support in View
- Oil Price Outlook: Crude Breakout Eyes August Highs- WTI Technicals
- New Zealand Dollar Outlook: NZD/USD Grinds at Resistance- Kiwi Levels
- US Dollar Outlook: DXY Sets Breakout Stage- USD Levels
- Australian Dollar Outlook: Aussie Reversal Threat- AUD/USD Levels
- Written by Michael Boutros, Currency Strategist with DailyFX
Follow Michael on Twitter @MBForex


