


Gold Technical Price Outlook: XAU/USD Near-term Trade Levels
- Gold price updated technical trade levels – Daily & Intraday Charts
- XAU/USD plunges into key lateral support at 1729/38- critical near-term resistance 1829
- New to Gold Trading? Get started with this Free How to Trade Gold -Beginners Guide
Gold prices have plunged more than 5.1% off the September highs with the sell-off taking XAU/USD back into key technical support. We’re on the lookout for a near-term breakout as price carves the weekly opening-range just above this major pivot zone. These are the updated targets and invalidation levels that matter on the XAU/USD technical charts. Review my latest Strategy Webinar for an in-depth breakdown of this gold technical setup and more.
Gold Price Chart - XAU/USD Daily
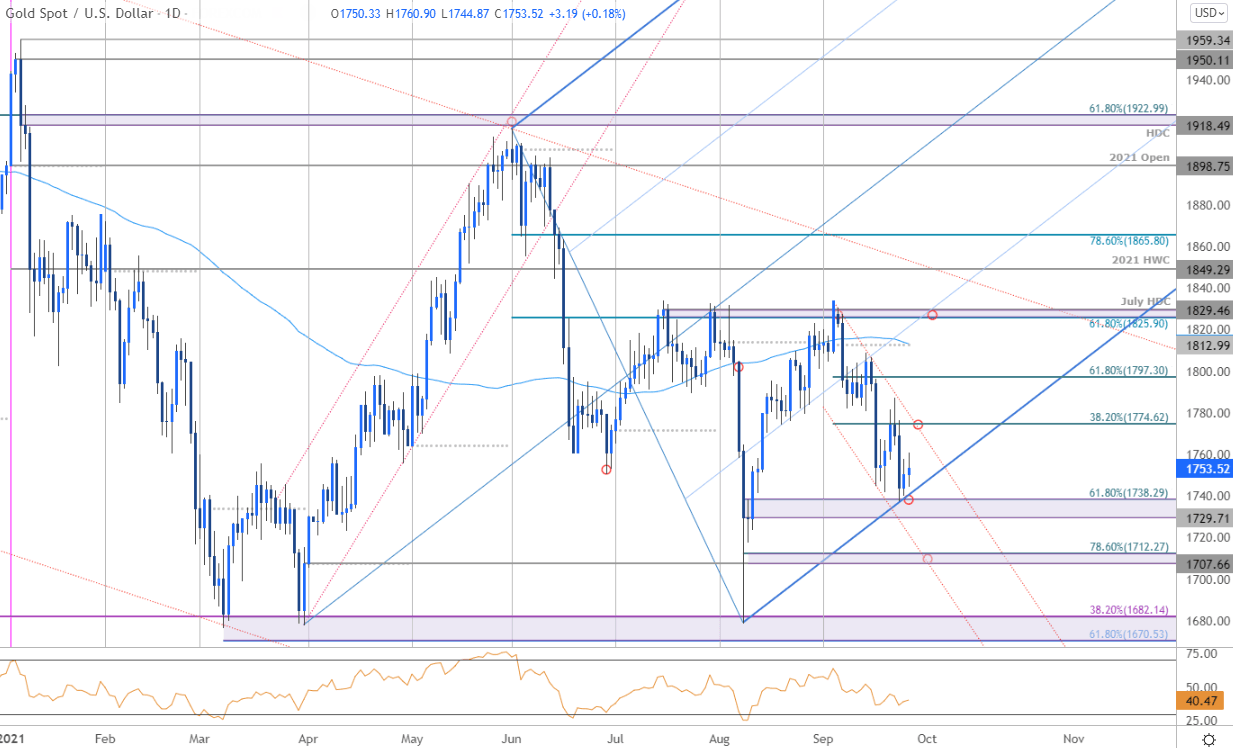
Chart Prepared by Michael Boutros, Technical Strategist; Gold on Tradingview
Technical Outlook: In my last Gold Price Outlook we highlighted a reversal off confluent resistance while noting that, “the threat remains for a deeper pullback while below 1814 but we’re on the lookout for an exhaustion low in the days ahead.” Gold registered a high at 1808 the following day before reversing sharply lower with the decline rebounding off confluent support at 1729/28- a region defined by the August low-day close and 61.8% Fibonacci retracement of the August advance. Note that the lower parallel of a proposed pitchfork off the March / August lows further highlights this threshold heading into the close of the month.
Gold Price Chart - XAU/USD 120min
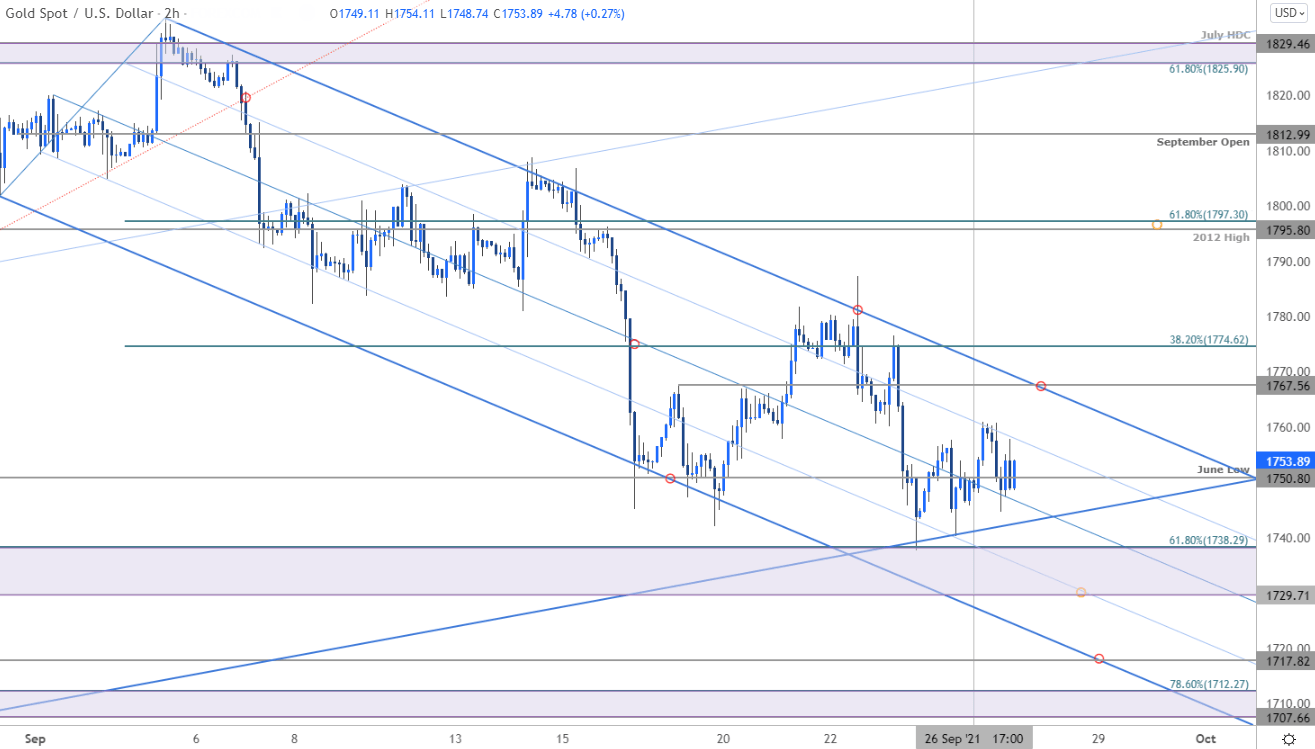
Notes: A closer look at Gold price action shows XAU/USD trading within the confines of a descending pitchfork formation we’ve been tracking off the monthly highs. The weekly opening-range is taking shape just above key support and we’re looking for the breakout to offer guidance in the days ahead.
Initial resistance stands at 1767 with a breach / close above the 38.2% retracement at 1774 needed to suggest a more significant low is in place. Subsequent topside objectives eyed at 1795/97 and the September open / 100-day moving average at 1812/13- look for a larger reaction there IF reached with a close above 1829 ultimately needed to mark resumption of the broader uptrend. A break below this key support zone would threaten another run at the yearly lows with such a scenario exposing the lower parallel near ~1717 and 1707/12. Critical support remains unchanged at 1670/82.

Bottom line: Gold is trading just above confluent support at 1729/38 – from a trading standpoint, a good zone to reduce short-exposure / lower protective stops. Losses should be limited this support zone IF price is indeed heading higher with a breach / close above 1774 needed to clear the way for a larger rally. Respect this zone – ultimately, a break lower would likely fuel another bout of accelerated losses, so stay nimble here. Review my latest Gold Weekly Price Outlook for a closer look at the longer-term XAU/USD technical trading levels.
For a complete breakdown of Michael’s trading strategy, review his Foundations of Technical Analysis series on Building a Trading Strategy
Gold Trader Sentiment – XAU/USD Price Chart
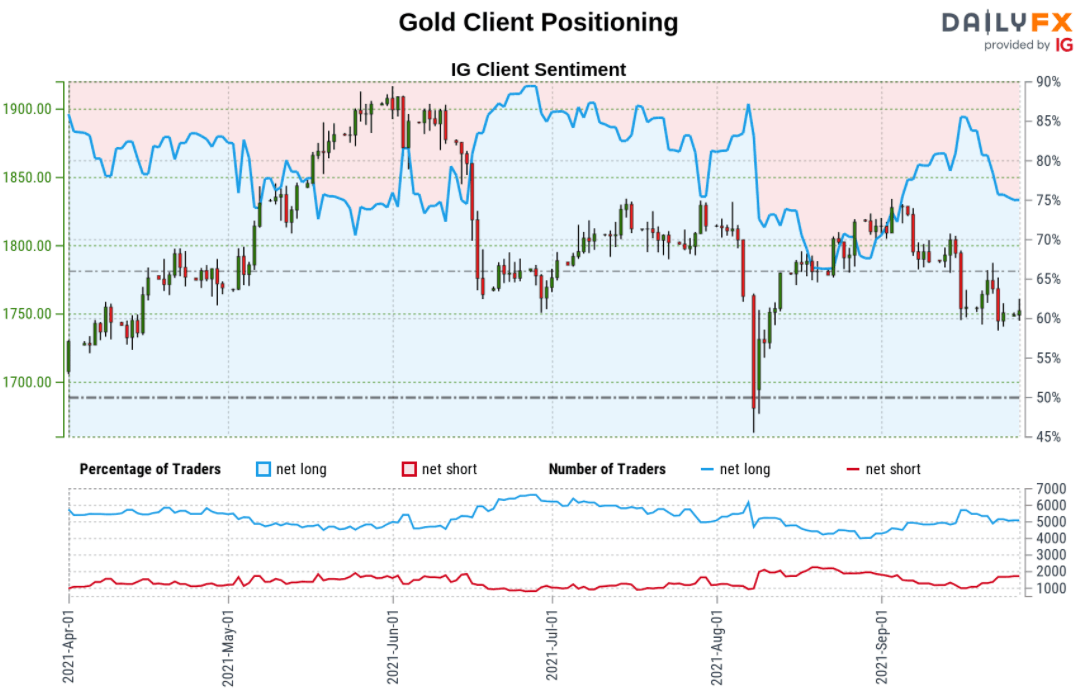
- A summary of IG Client Sentiment shows traders are net-long Gold- the ratio stands at +2.96 (74.72% of traders are long) – typically bearishreading
- Long positions are2.23% higher than yesterday and 5.50% lower from last week
- Short positions are2.69% higher than yesterday and 36.23% higher from last week
- We typically take a contrarian view to crowd sentiment, and the fact traders are net-long suggests Gold prices may continue to fall. Yet traders are less net-long than yesterday and compared with last week. Recent changes in sentiment warn that the current Gold price trend may soon reverse higher despite the fact traders remain net-long.
| Change in | Longs | Shorts | OI |
| Daily | 1% | -3% | -1% |
| Weekly | 2% | -8% | -2% |
---
Active Technical Setups
- Bitcoin Outlook: BTC/USD Bounce From 40K, Fake-out or Shake-out?
- Sterling Outlook: GBP/USD Plunge Breaks Monthly Range- Support in View
- Oil Price Outlook: Crude Breakout Eyes August Highs- WTI Technicals
- Canadian Dollar Outlook: USD/CAD Breakout Imminent- Loonie Levels
- New Zealand Dollar Outlook: NZD/USD Grinds at Resistance- Kiwi Levels
- US Dollar Outlook: DXY Sets Breakout Stage- USD Levels
- Gold Price Outlook: Gold Plunge Searches for Support- XAU/USD Levels
- Australian Dollar Outlook: Aussie Reversal Threat- AUD/USD Levels
- Written by Michael Boutros, Technical Strategist with DailyFX
Follow Michael on Twitter @MBForex


