


Sterling Technical Price Outlook: GBP/USD Near-term Trade Levels
- Sterling technical trade level update – Daily & Intraday Charts
- GBP/USD breakout stretches into first resistance hurdle – risk for near-term exhaustion
- Support 1.3707, 1.3646 (key) - Resistance 1.3832, 1.3865 (key)
Sterling is attempting to mark a third consecutive weekly advance against the US Dollar with GBP/USD up more than 0.5% since the Sunday open. The rally takes GBP/USD into the first major resistance zone and the focus is on possible near-term inflection into these levels. These are the updated targets and invalidation levels that matter on the GBP/USD price charts. Review my latest Weekly Strategy Webinar for an in-depth breakdown of this Sterling technical setup and more.
Sterling Price Chart – GBP/USD Daily
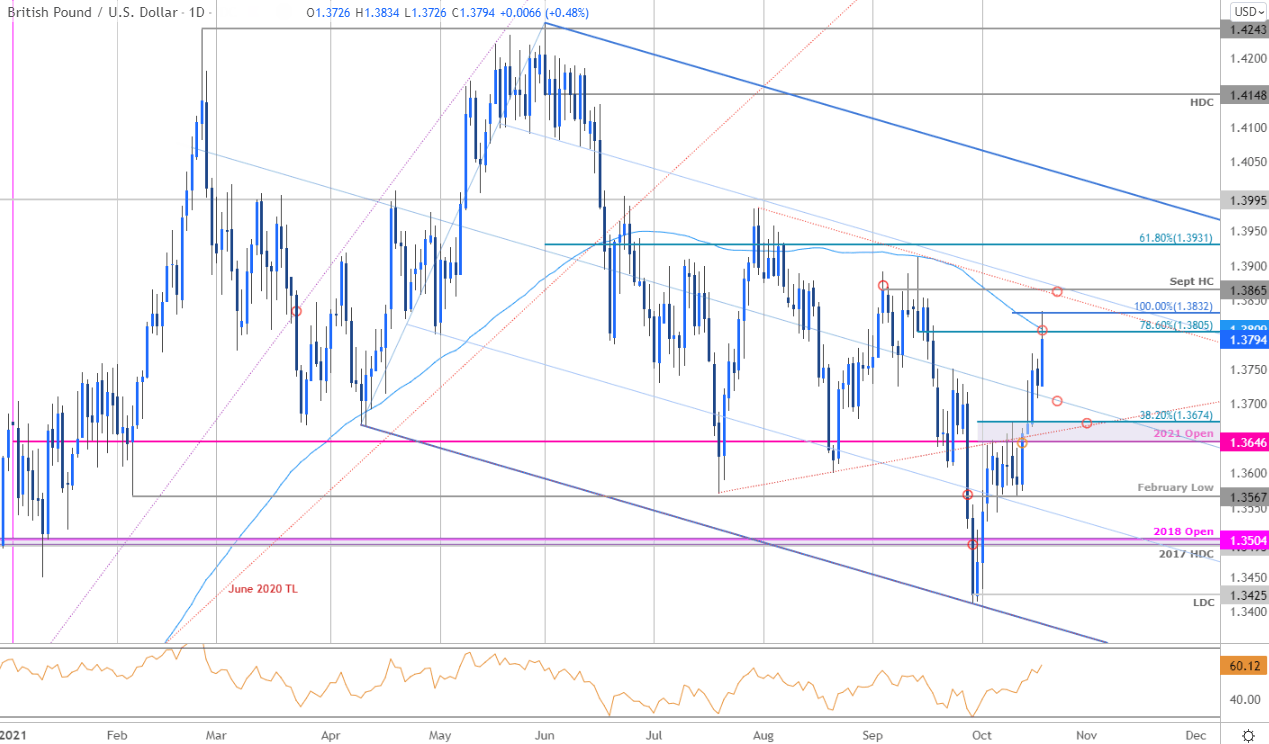
Chart Prepared by Michael Boutros, Technical Strategist; GBP/USD on Tradingview
Technical Outlook: In last month’s Sterling Outlook we noted that GBP/USD had, “broken the monthly opening-range with the decline now testing key support into the objective yearly open – we’re looking for a reaction here.” We got one! The level in focus was the objective yearly open at 1.3646 – a break lower into the close of September saw Sterling plummet more than 2% before reversing sharply off downtrend support. A topside breach of the October opening-range has fueled a rally of nearly 3.2% off that low with the advance now testing a critical resistance confluence at 1.3805/32 – a region defined by the 78.6% Fibonacci retracement of the September decline, the 100-day moving average and the 100% extension of the ascent off the September low. Ultimately, a breach / close above the September high-close at 1.3865 is needed to fuel the next leg higher towards the 61.8% retracement at 1.3931. That said, the near-term risk remains for possible topside exhaustion while below these levels.
Sterling Price Chart – GBP/USD 120min
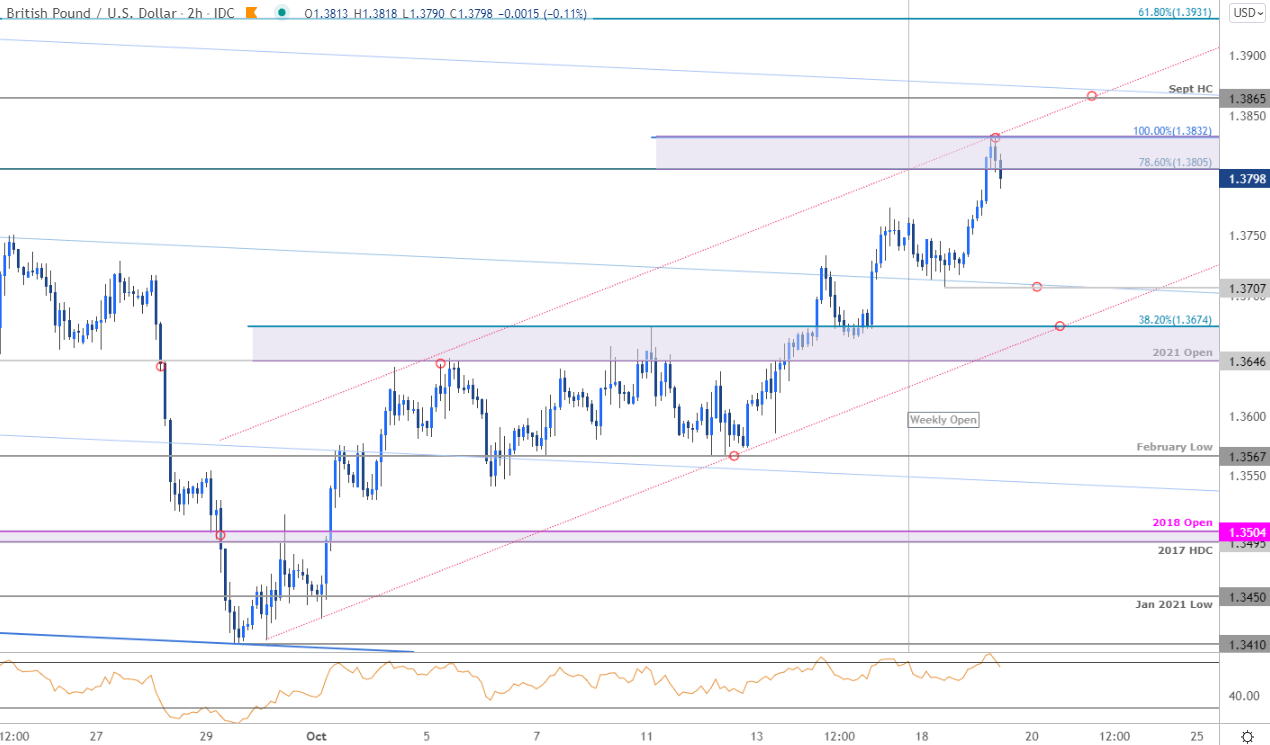
Notes: A closer look at Sterling price action shows GBP/USD trading within the confines of an ascending channel formation with price exhausting today into confluent resistance at the upper parallel. Initial support now eyed at the objective weekly-range lows at 1.3707 with near-term bullish invalidation now raised to the yearly open / 38.2% retracement at 1.3646/74.

Bottom line: The Sterling breakout has is extended into uptrend resistance. From a trading standpoint, a good zone to reduce long-exposure / raise protective stops – losses should be limited to the yearly open at 1.3646 IF price is heading higher with a close above 1.3865 likely to fuel another accelerated push higher. Stay nimble heading into UK inflation data tomorrow- ultimately a break below this formation would mark resumption of the broader downtrend. I’ll publish an updated British Pound Weekly Price Outlook once we get further clarity on the longer-term GBP/USD technical trade levels.
For a complete breakdown of Michael’s trading strategy, review his Foundations of Technical Analysis series on Building a Trading Strategy
Sterling Trader Sentiment – GBP/USD Price Chart
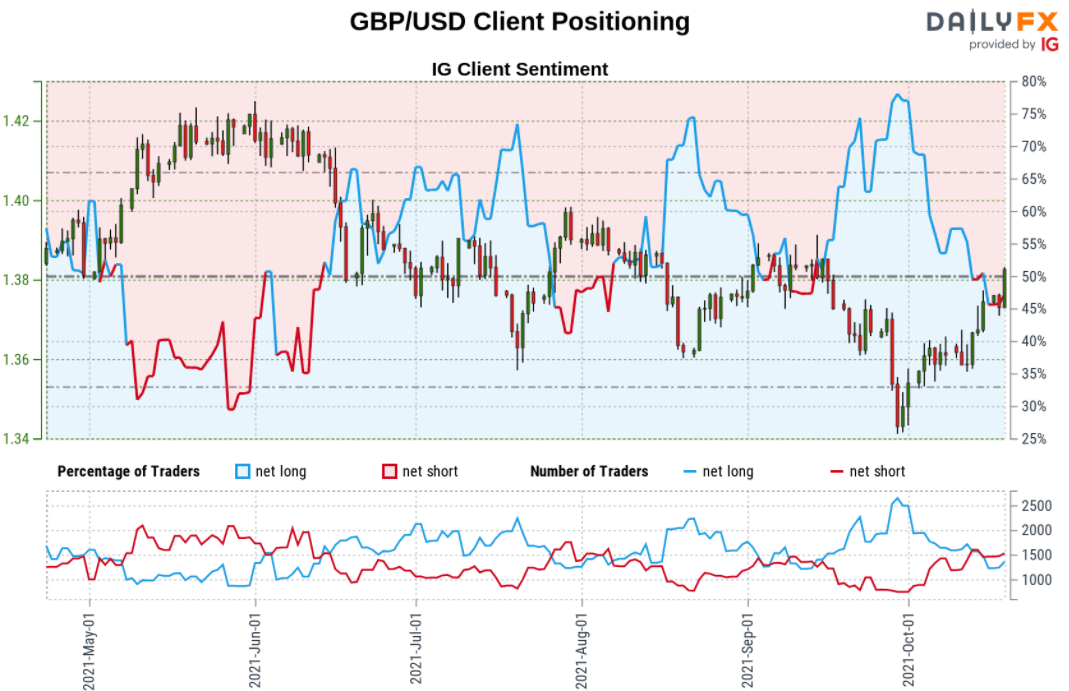
- A summary of IG Client Sentiment shows traders are net-long GBP/USD - the ratio stands at +1.16 (46.22% of traders are long) – neutral reading
- Long positions are1.93% lower than yesterday and 23.39% lower from last week
- Short positions are3.94% lower than yesterday and 1.99% higher from last week
- We typically take a contrarian view to crowd sentiment, and the fact traders are net-short suggests GBP/USD prices may continue to rise. Positioning is less net-short than yesterday but more net-short from last week. The combination of current sentiment and recent changes gives us a further mixed GBP/USD trading bias.
| Change in | Longs | Shorts | OI |
| Daily | 3% | -7% | -3% |
| Weekly | 4% | -10% | -5% |
---
UK / US Economic Calendar

Economic Calendar - latest economic developments and upcoming event risk.
Active Technical Setups
- Gold Price Outlook: Gold Fails at 1800- XAU/USD Retreats to Support
- Oil Price Outlook: Oil Rips 32% in Eight Weeks- WTI Breakout Levels
- Canadian Dollar Outlook: USD/CAD Coils at Key Support- Breakout Levels
- Bitcoin Outlook: BTC/USD Soars into October- Breakout Levels
- Written by Michael Boutros, Currency Strategist with DailyFX
Follow Michael on Twitter @MBForex


