


Gold Technical Price Outlook: XAU/USD Near-term Trade Levels
- Gold price updated technical trade levels – Daily & Intraday Charts
- XAU/USD rally falters- risk for exhaustion low ahead of 1752, key resistance 1795
- New to Gold Trading? Get started with this Free How to Trade Gold -Beginners Guide
Gold prices plummeted more than 2.2% off the monthly high last week with the XAU/USD reversing off multi-month downtrend resistance. The pullback is now approaching support and we’re on the lookout for an exhaustion low in the days ahead. These are the updated targets and invalidation levels that matter on the XAU/USD technical charts. Review my latest Strategy Webinar for an in-depth breakdown of this gold technical setup and more.
Gold Price Chart - XAU/USD Daily

Chart Prepared by Michael Boutros, Technical Strategist; Gold on Tradingview
Technical Outlook: In my last Gold Price Outlook we warned that XAU/USD had, “made a strong defense of support into the close of September with the October opening-range set just above uptrend support- we’re on breakout watch. From a trading standpoint, look for downside exhaustion head of the lower parallel IF price is indeed heading higher with a breach above 1791/95 needed to fuel the next leg-up in price.” A near-term breakout last week saw price register an intraday high at 1800 before pulling back with price unable to close above the June trendline / 100-day moving average. We’re on the lookout for possible downside exhaustion on this pullback.
Daily support rests at the 61.8% Fibonacci retracement of the late-September rally at 1751 – we’ll reserve this threshold as our near-term bullish invalidation level with a break below threatening another bout of acerated losses towards key support at 1725/29.
Gold Price Chart - XAU/USD 120min
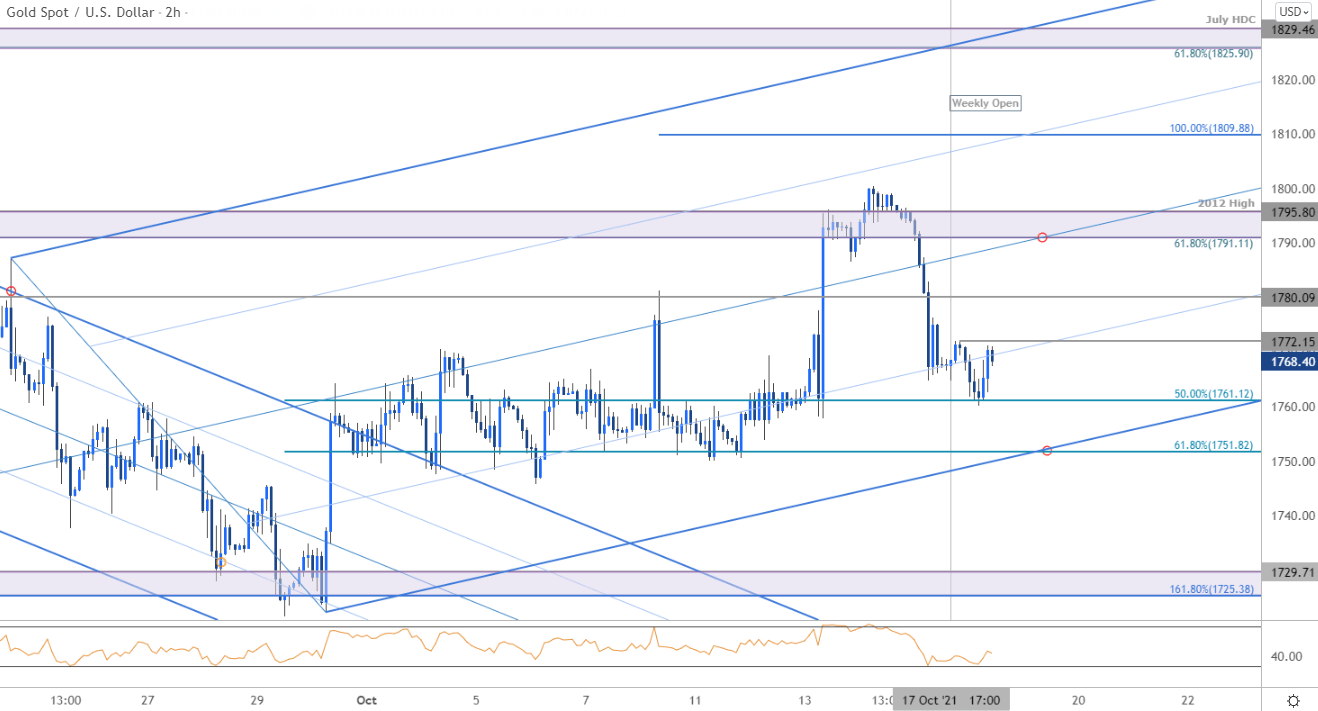
Notes: A closer look at Gold price action shows XAU/USD continuing to trade within the confines of an ascending pitchfork formation extending off the September lows. Initial support rests at 1761 backed by the lower parallel / 61.8% retracement at 1751- losses should be limited to this threshold IF price is indeed heading higher. Initial resistance steady at 1780 backed by 1791/95- a breach of the highs exposing subsequent objectives at the 100% extension at 1809 and a more critical confluence at 1825/29 – a region defined by the 61.8% retracement of the June decline and the July high-day close. Look for a larger reaction there IF reached.

Bottom line: A pullback from a major resistance pivot last week has us looking for uptrend support on ahead of 1751. From a trading standpoint, be on the lookout for an exhaustion low ahead of the lower parallels with a breach / daily close above 1795 still needed to mark resumption of the broader uptrend. Review my latest Gold Weekly Price Outlook for a closer look at the longer-term XAU/USD technical trading levels.
For a complete breakdown of Michael’s trading strategy, review his Foundations of Technical Analysis series on Building a Trading Strategy
Gold Trader Sentiment – XAU/USD Price Chart
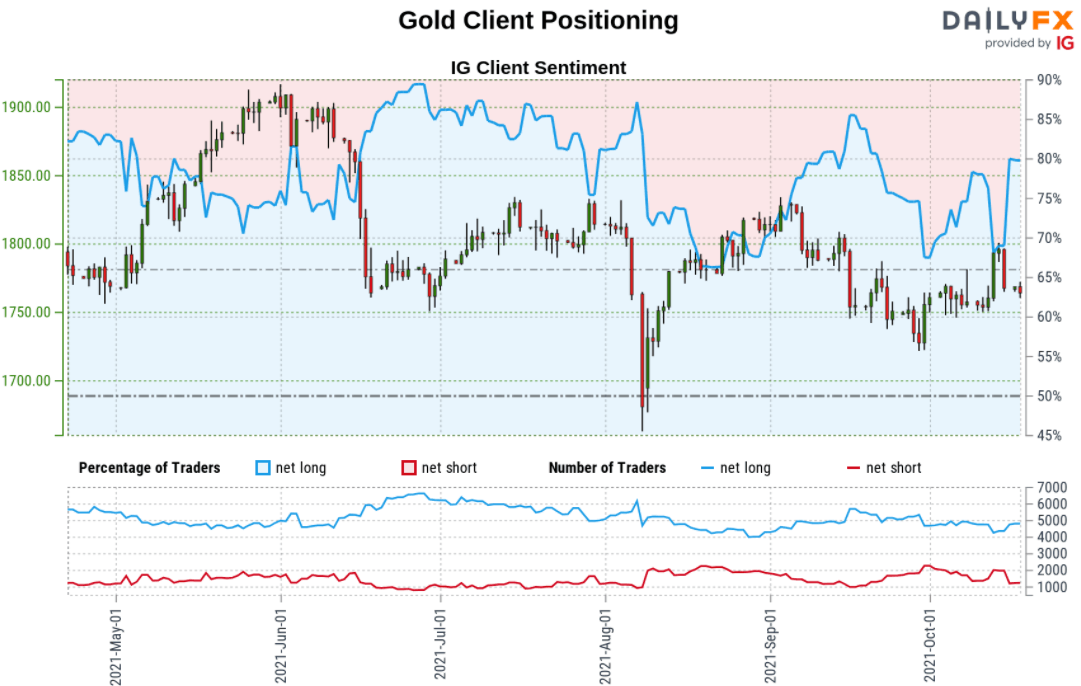
- A summary of IG Client Sentiment shows traders are net-long Gold- the ratio stands at +3.76 (78.98% of traders are long) – typically bearishreading
- Long positions are2.04% higher than yesterday and 0.34% lower from last week
- Short positions are10.96% higher than yesterday and 10.23% lower from last week
- We typically take a contrarian view to crowd sentiment, and the fact traders are net-long suggests Gold prices may continue to fall. Traders are less net-long than yesterday but more net-long from last week. The combination of current positioning and recent changes gives us a further mixed Gold trading bias from a sentiment standpoint.
| Change in | Longs | Shorts | OI |
| Daily | 1% | -3% | -1% |
| Weekly | 2% | -8% | -2% |
---
Active Technical Setups
- Oil Price Outlook: Oil Rips 32% in Eight Weeks- WTI Breakout Levels
- Canadian Dollar Outlook: USD/CAD Coils at Key Support- Breakout Levels
- Bitcoin Outlook: BTC/USD Soars into October- Breakout Levels
- Sterling Outlook: GBP/USD Plunge Breaks Monthly Range- Support in View
- Written by Michael Boutros, Technical Strategist with DailyFX
Follow Michael on Twitter @MBForex


