


Gold Technical Price Forecast: Neutral
- Gold price updated technical trade levels - Weekly Chart
- XAU/USD coils above long-term uptrend support- focus on breakout of the 1738-1791 range
- New to Gold Trading? Get started with this Free How to Trade Gold -Beginners Guide
Gold prices pressed higher this week with XAU/USD up more than 0.5% in early US trade on Friday. The advance keeps gold within the confines of a well-defined range just above long-term uptrend support. The medium-term outlook hinges on a breakout of this critical range heading into the second half of October. These are the updated targets and invalidation levels that matter on the XAU/USD weekly technical chart. Review my latest Weekly Strategy Webinar for an in-depth breakdown of this gold technical setup and more.
Gold Price Chart - XAU/USD Weekly
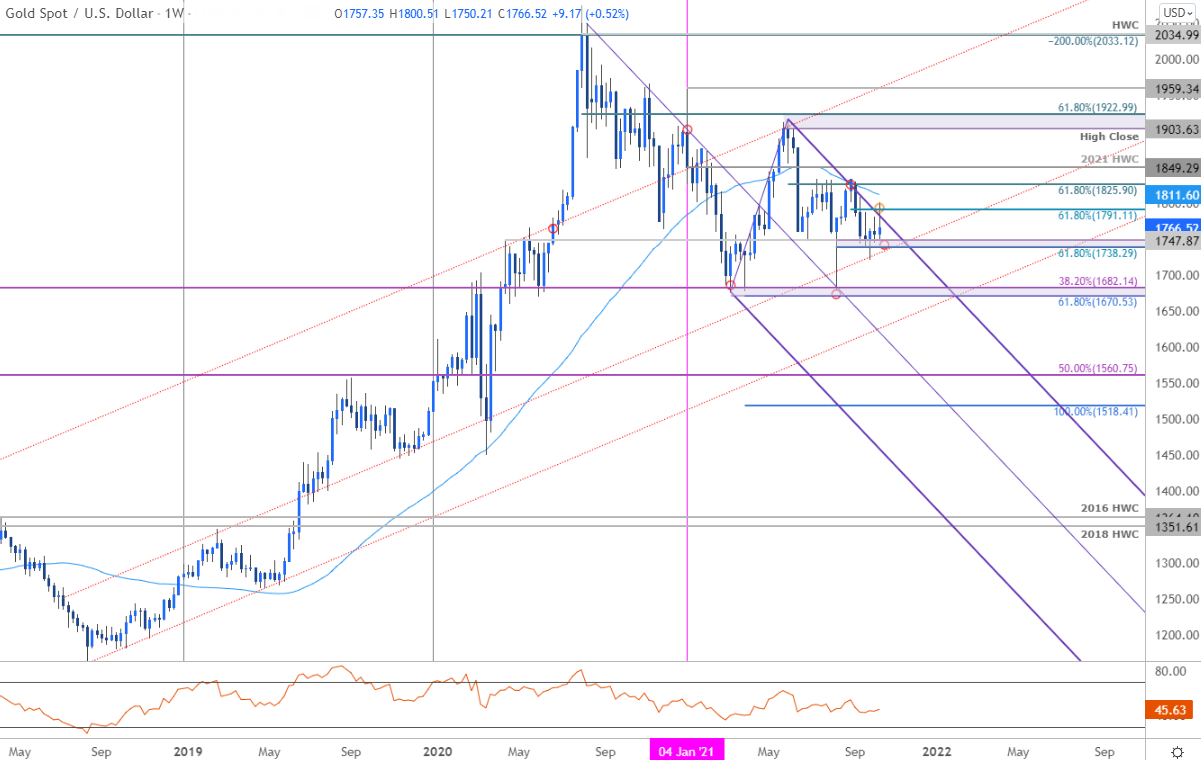
Chart Prepared by Michael Boutros, Technical Strategist; Gold on Tradingview
Notes: In my last Gold Weekly PriceOutlook we noted that the XAU/USD had, “failed a third attempt to close below key support at 1738/47 – the immediate focus once again is on possible inflection off this mark into the October open. From a trading standpoint, look for losses to be limited to this week’s low IF price is heading higher with a close above 1791 needed to fuel a larger recovery.” Gold respected a test of the lows with the subsequent rally faltering just above the 1791 resistance confluence before pulling back- the battlelines are drawn heading into next week.
Key support remains with the 61.8% retracement of the August rally / April 2020 high at 1738/47- a break / close below this threshold would threaten another accelerated sell-off with such a scenario exposing critical support at 1670/82- a region define by the 61.8% Fibonacci extension of the 2020 decline, the 2021 yearly low and the broader 38.2% retracement of the late-2015 advance. A topside breach of this formation would shift the focus towards the 52-week moving average (currently ~1811) and the 61.8% retracement of the June decline at 1825. Ultimately a close above the yearly high-week close at 1849 is still needed to mark resumption of the broader uptrend in gold.

Bottom line: Gold has been testing the bounds of a critical range for the past five weeks and while the broader focus remains constructive, we’re on the lookout for a breakout to offer guidance on the medium-term outlook. From a trading standpoint, the focus remains unchanged- pullbacks should be limited to 1738 IF price is heading higher with a weekly close above 1791 needed to fuel larger recovery. Keep in mind there is a flurry of inflation data next week from New Zealand, UK, Eurozone, and Japan- stay nimble and respect a breakout of this range. A close below parallel support could see another accelerated bout of losses for the yellow metal. Review my latest Gold Price Outlook for a closer look at the near-term XAU/USD technical trade levels.
For a complete breakdown of Michael’s trading strategy, review his Foundations of Technical Analysis series on Building a Trading Strategy
Gold Trader Sentiment – XAU/USD Price Chart

- A summary of IG Client Sentiment shows traders are net-long Gold- the ratio stands at +2.50 (71.42% of traders are long) – typically bearishreading
- Long positions are1.44% lower than yesterday and 11.29% lower from last week
- Short positions are7.88% lower than yesterday and 2.04% higher from last week
- We typically take a contrarian view to crowd sentiment, and the fact traders are net-long suggests Gold prices may continue to fall. Traders are more net-long than yesterday but less net-long from last week. The combination of current positioning and recent changes gives us a further mixed Gold trading bias from a sentiment standpoint.
| Change in | Longs | Shorts | OI |
| Daily | 1% | -3% | -1% |
| Weekly | 2% | -8% | -2% |
---
Previous Weekly Technical Charts
- US Dollar Index (DXY)
- Crude Oil (WTI)
- Canadian Dollar (USD/CAD)
- Euro (EUR/USD)
- Sterling (GBP/USD)
- Japanese Yen (USD/JPY)
- Written by Michael Boutros, Currency Strategist with DailyFX
Follow Michael on Twitter @MBForex


