


US Dollar Technical Price Outlook: DXY Weekly Trade Levels
- US Dollar technical trade level update – Weekly Chart
- USD attempts fifth weekly advance- rally vulnerable while below key technical resistance
- DXY weekly support at 93.76, 92.48 (bullish invalidation) – Key resistance 94.47/65, 95.15
The US Dollar Index is virtually unchanged (+0.02%) this week with DXY holding just below technical resistance for a second week. While a breakout of the yearly opening-range does keep the broader outlook weighted to the topside, the advance may be stalling here as price struggles to close out a fifth consecutive weekly advance. These are the updated technical targets and invalidation levels that matter on the US Dollar Index weekly price chart. Review my latest Strategy Webinar for an in-depth breakdown of this DXY technical setup and more.
US Dollar Index Price Chart – DXY Weekly
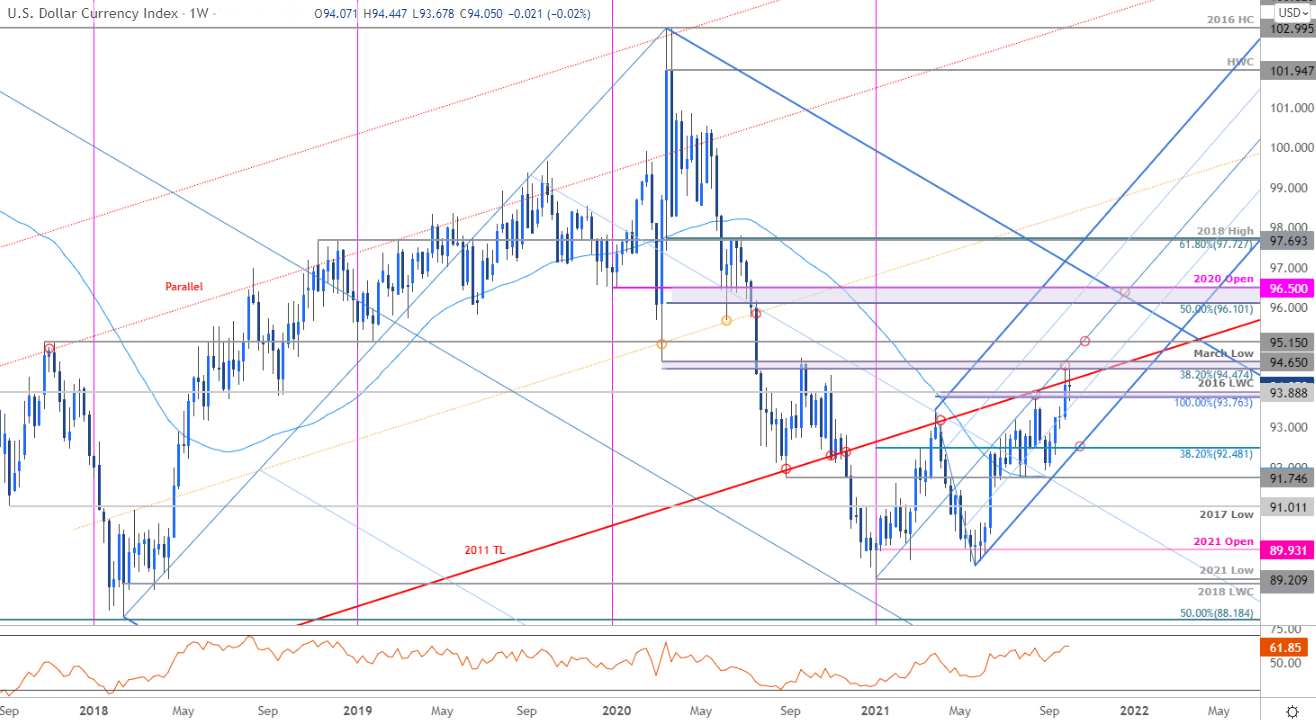
Chart Prepared by Michael Boutros, Technical Strategist; US Dollar Index on Tradingview
Notes: In my last US Dollar Weekly Price Outlook we noted that the DXY breakout had, “US Dollar breakout has extended into major technical resistance here at fresh yearly highs and the focus is on possible price inflection just higher.” The level in focus was 94.47/65- a region define by the 38.2% Fibonacci retracement of the 2020 decline and the March 2020 low. Price registered a high at 94.50 before pulling back with DXY poise to mark a weekly doji this week. Has the rally stalled?
Initial weekly support now eyed at 93.76/88 with key support / near-term bullish invalidation now raised to the lower parallel / 38.2% retracement of the yearly range at 92.48. A topside breach / close above the median-line exposing subsequent objectives at the October / November 2017 swing highs at 95.15 and critical resistance confluence at 96.10/50. Note that the 2011 original slope (red) also converges on this region and further highlights the technical significance of this zone- expect a larger / more significant reaction in price there IF reached.
For a complete breakdown of Michael’s trading strategy, review his Foundations of Technical Analysis series on Building a Trading Strategy
Bottom line: The US Dollar breakout may be stalling here into uptrend resistance and while the broader focus remains constructive, the immediate advance may be vulnerable in the weeks ahead. From at trading standpoint, a good zone to reduce long-exposure / raise protective stops – be on the lookout for downside exhaustion ahead of uptrend support on pullbacks with a breach higher from here likely to fuel another accelerated advance towards the upper parallels. I’ll publish an updated US Dollar Price Outlook once we get further clarity on the near-term technical DXY trading levels.

Key US Data Releases
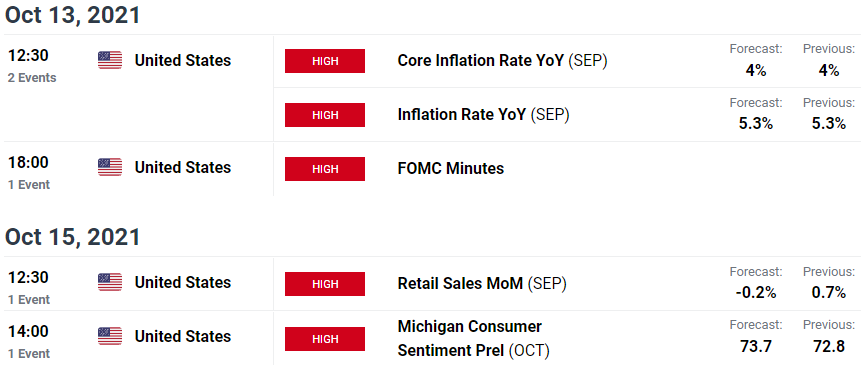
Economic Calendar - latest economic developments and upcoming event risk.
Previous Weekly Technical Charts
- Crude Oil (WTI)
- Canadian Dollar (USD/CAD)
- Euro (EUR/USD)
- Gold (XAU/USD)
- Sterling (GBP/USD)
- Japanese Yen (USD/JPY)
--- Written by Michael Boutros, Technical Strategist with DailyFX
Follow Michael on Twitter @MBForex


