


US Dollar Technical Price Outlook: DXY Weekly Trade Levels
- US Dollar technical trade level update – Weekly Chart
- USD marks fourth weekly advance- rally vulnerable into key resistance pivot just higher
- DXY weekly support at 92.48 (bullish invalidation) – Key resistance 94.47/65, 95.15
The US Dollar Index surged more than 1% this week with a four-week winning streak taking DXY into fresh yearly highs. The rally now targets a major resistance pivot just higher and the focus is on possible price inflection with the broader advance vulnerable into the March 2020 lows. These are the updated technical targets and invalidation levels that matter on the US Dollar Index weekly price chart heading into October open. Review my latest Strategy Webinar for an in-depth breakdown of this DXY technical setup and more.
US Dollar Index Price Chart – DXY Weekly
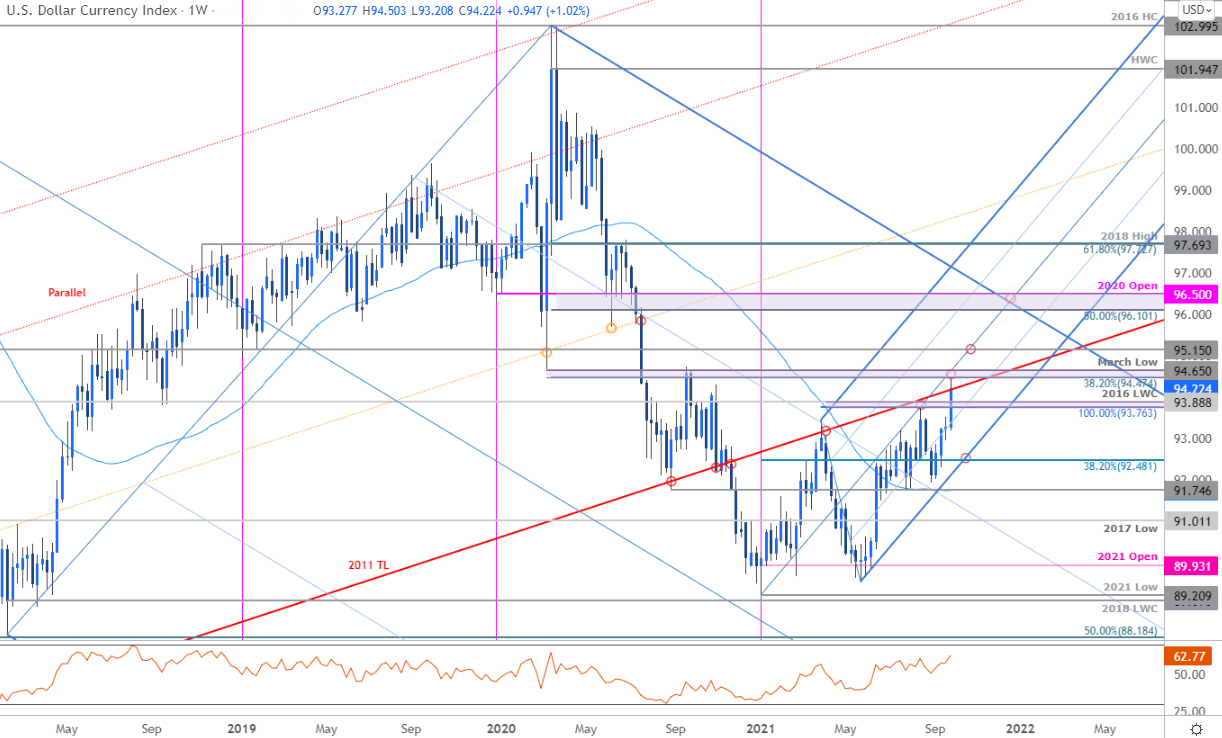
Chart Prepared by Michael Boutros, Technical Strategist; US Dollar Index on Tradingview
Notes: In my last US Dollar Weekly Price Outlook we noted that the DXY rally had, “faltered just ahead of major technical resistance and the threat for a deeper pullback remains while below 93.76/88. From a trading standpoint, look for possible downside exhaustion ahead of 91.74 IF price is indeed heading higher with a breach / close above the median-line ultimately needed to mark resumption of the broader uptrend.” Price registered a low at 91.94 the following week before reversing higher with a breakout this week taking the index into a major resistance confluence at 94.47/65- a region define by the 38.2% Fibonacci retracement of the 2020 decline and the March 2020 low. The immediate advance may be vulnerable into this threshold heading into the October / Q4 open.
Initial weekly support now rest at 93.76 backed closely by the August high-week close at 93.45 with broader bullish invalidation now raised to the lower parallel / 38.2% retracement near ~92.50. A topside breach from here keeps the focus on the October 2017 swing highs at 95.15 and a more significant resistance range at the 50% retracement / 2020 yearly open at 96.10/50- look for a larger price reaction there IF reached.
For a complete breakdown of Michael’s trading strategy, review his Foundations of Technical Analysis series on Building a Trading Strategy
Bottom line: The US Dollar breakout has extended into major technical resistance here at fresh yearly highs and the focus is on possible price inflection just higher. From at trading standpoint, look to reduce long-exposure / raise protective stops on a test of the 94.47/65 resistance zone - losses should be limited to pitchfork support IF price is indeed heading higher with a breach / close above the median-line needed to fuel the next leg higher in price. Keep in mind that the index has now cleared the yearly opening-range highs and keeps the focus on a fourth-quarter high in price. Review my latest US Dollar Price Outlook for a closer look at the near-term technical DXY trading levels.

---
Key US Data Releases

Economic Calendar - latest economic developments and upcoming event risk.
Previous Weekly Technical Charts
- Sterling (GBP/USD)
- Japanese Yen (USD/JPY)
- Gold (XAU/USD)
- Australian Dollar (AUD/USD)
- Canadian Dollar (USD/CAD)
- Sterling (GBP/USD)
- Crude Oil (WTI)
- Euro (EUR/USD)
--- Written by Michael Boutros, Technical Strategist with DailyFX
Follow Michael on Twitter @MBForex


