


US Dollar Technical Price Outlook: DXY Near-term Trade Levels
- US Dollar technical updated technical trade levels – Daily & Intraday Charts
- USD reverses from technical resistance – risk for further losses near-term
- Weekly open resistance 93.93 – Key near-term support 93.36/45, 92.63/66
The US Dollar Index is under pressure for the second consecutive week after reversing off key technical resistance. While the broader outlook remains constructive, a break of the monthly opening-range threatens a larger correction in the days ahead with DXYalready down more than 1% off the yearly highs. These are the updated technical targets and invalidation levels that matter on the US Dollar Index price chart. Review my latest Strategy Webinar for an in-depth breakdown of this DXY technical setup and more.
US Dollar Index Price Chart – DXY Daily

Chart Prepared by Michael Boutros, Technical Strategist; US Dollar Index on Tradingview
Technical Outlook: In last month’s US Dollar Price Outlook, we noted that DXY had, “set the September opening-rang just above uptrend support. From a trading standpoint, look to the break for guidance – be on the lookout for downside exhaustion ahead of the 92-handle IF price breaks lower with a close above the median needed to fuel another run at key resistance at the November / August high-day closes at 93.40/45.” The index registered a low at 92.32 in the following days before ripping higher with a breach of the monthly opening-range charging a rally through the 93.40/45 resistance level into the close of the month. The rally was capped by resistance at 94.47/65 with a break of the October opening-range lows today threatens a deeper correction in the greenback in the days ahead within the confines of the broader uptrend.
US Dollar Index Price Chart – DXY 120min
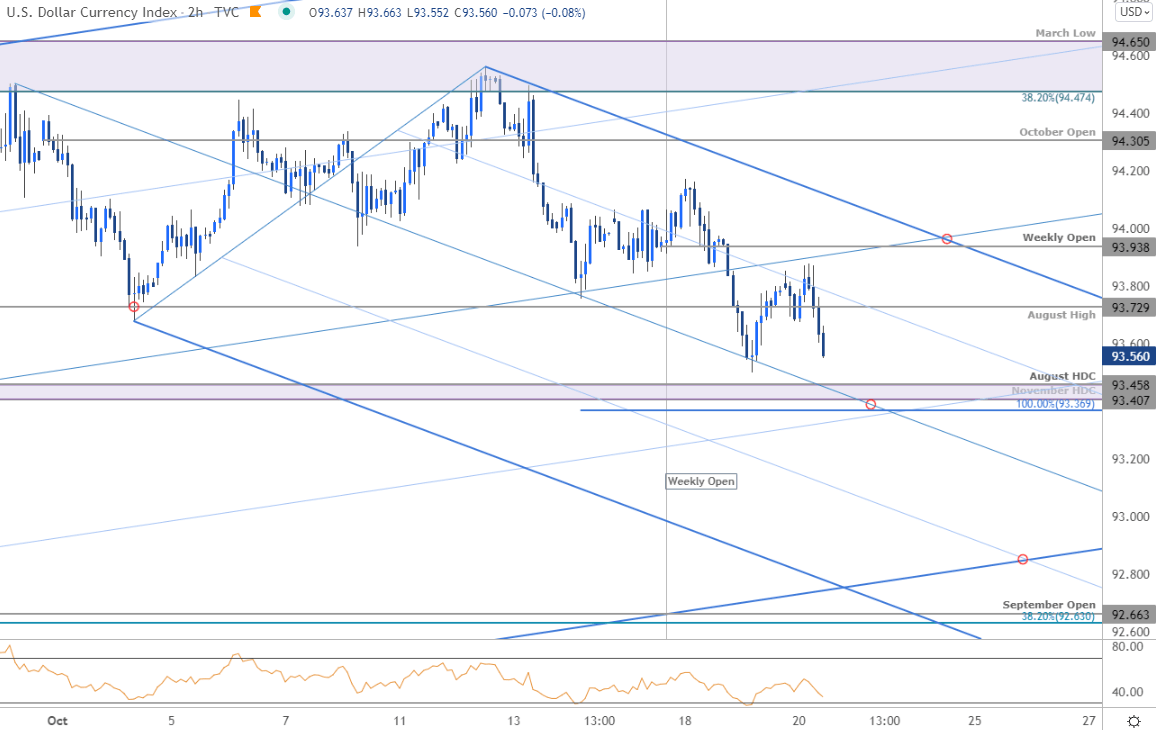
Notes: A closer look at DXY price action shows the dollar trading within the confines of an embedded descending pitchfork formation we’ve been tracking off the September / October highs with the median-line further highlighting near-term support at 93.36/45. Look for a reaction there IF reached with a break below threatening a deeper correction towards the highlighted trendline confluence near ~92.85 and the 38.2% retracement of the May rally / September open at 92.63/66- both areas of interest for possible downside exhaustion IF reached. Initial resistance now back at the August high at 93.72 backed by the weekly open at 93.93- ultimately a topside breach of this formation would be needed to mark resumption of the broader Dollar uptrend with such a scenario once again targeting the October open at 94.30 and critical resistance into 94.47/65.

Bottom line: A reversal off confluent uptrend resistance in the US Dollar threatens a deeper pullback in the days ahead while below within this near-term formation. From at trading standpoint, look for topside exhaustion ahead of the weekly open IF price is indeed heading lower on this stretch with a break below 93.36 risking another bout of accelerated losses. Ultimately, a larger pullback may offer more favorable opportunities closer to longer-term uptrend support. Review my latest US Dollar Weekly Price Outlook for an in-depth look at the longer-term DXY technical trade levels.
For a complete breakdown of Michael’s trading strategy, review his Foundations of Technical Analysis series on Building a Trading Strategy
---
Key US Economic Data Releases

Economic Calendar - latest economic developments and upcoming event risk.
Active Technical Setups
- Sterling Outlook: GBP/USD Breakout Runs Resistance- Sink or Swim?
- Gold Price Outlook: Gold Fails at 1800- XAU/USD Retreats to Support
- Oil Price Outlook: Oil Rips 32% in Eight Weeks- WTI Breakout Levels
- Canadian Dollar Outlook: USD/CAD Coils at Key Support- Breakout Levels
- Bitcoin Outlook: BTC/USD Soars into October- Breakout Levels
- Written by Michael Boutros, Currency Strategist with DailyFX
Follow Michael on Twitter @MBForex


