


Canadian Dollar Technical Price Outlook: Near-term Trade Levels
- Canadian Dollar updated technical trade levels – Daily & Intraday Charts
- USD/CAD four-week breakdown stalls into technical downtrend support
- Resistance 1.2440, September channel (key)- support 1.22849 (key), 1.2247, 1.2208
The Canadian Dollar is virtually unchanged against the US Dollar since the start of the week despite a range of nearly 1% with a four-week decline in USD/CAD taking price into another major support hurdle. These are the updated targets and invalidation levels that matter on the USD/CAD price charts heading into key US Inflation data tomorrow. Review my latest Strategy Webinar for an in-depth breakdown of this Loonie technical setup and more.
Canadian Dollar Price Chart – USD/CAD Daily

Chart Prepared by Michael Boutros, Technical Strategist; USD/CAD on Tradingview
Technical Outlook: In my last Canadian Dollar Price Outlook we noted that USD/CAD was trading just above key support at 1.2422/40 while warning that a, “break lower from here would threaten another bout of losses towards subsequent support objectives at the March low / 61.8% retracement at 1.2365/66 and the July lows at 1.2302.” Price registered a low at 1.2288 today before rebounding off the September channel support. Is an near-term exhaustion low in place?
Canadian Dollar Price Chart – USD/CAD 120min

Notes: A closer look at Loonie price action shows USD/CAD trading within an embedded descending channel of a sharper slope. Support remains steady at the 1.618% extension of the September decline / July low at 1.2284-1.2302 – a break below this threshold could fuel another bour off losses with such a scenario exposing the 2018 low at 1.2247 and the 78.6% retracement at 1.2208- both areas of interest for possible downside exhaustion IF reached. Initial resistance now back at the March low / 61.8% Fibonacci retracement of the yearly range at 1.2365/66 backed by 1.2422/40 with a breach / close above the channel needed to shift the focus higher again.

Bottom line: The USD/CAD sell-off has responded to downtrend support and we’re on the lookout for possible price inflection here. From at trading standpoint, a good zone to reduce short-exposure / lower protective stops – rebounds should be capped by 1.2440 IF price is heading lower. Ultimately, we’re looking for downside exhaustion in the days ahead and a larger recovery could offer more favorable entries closer to trend resistance. Review my latest Canadian Dollar Weekly Price Outlook for a closer look at the longer-term USD/CAD technical trade levels.
For a complete breakdown of Michael’s trading strategy, review his Foundations of Technical Analysis series on Building a Trading Strategy
Canadian Dollar Trader Sentiment – USD/CAD Price Chart

- A summary of IG Client Sentiment shows traders are net-long USD/CAD - the ratio stands at +2.68 (72.83% of traders are long) – typically bearish reading
- Long positions are3.11% lower than yesterday and 5.39% higher from last week
- Short positions are 14.68% lower than yesterday and 5.34% lower from last week
- We typically take a contrarian view to crowd sentiment, and the fact traders are net-long suggests USD/CAD prices may continue to fall. Traders are further net-long than yesterday and last week, and the combination of current positioning and recent changes gives us a stronger USD/CAD-bearish contrarian trading bias from a sentiment standpoint.
| Change in | Longs | Shorts | OI |
| Daily | 27% | -12% | -2% |
| Weekly | 22% | -5% | 2% |
---
Key US / Canada Data Releases
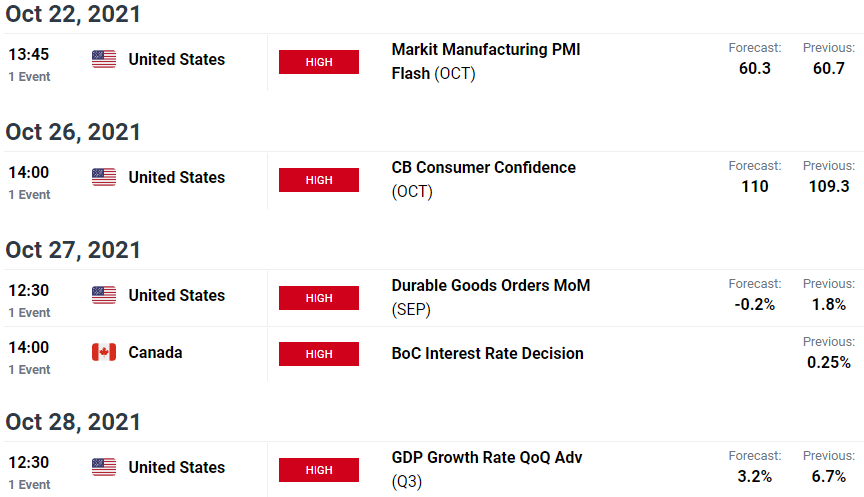
Economic Calendar - latest economic developments and upcoming event risk.
Active Technical Setups
- US Dollar Outlook: USD Snaps Support- DXY Breakdown Levels
- Sterling Outlook: GBP/USD Breakout Runs Resistance- Sink or Swim?
- Gold Price Outlook: Gold Fails at 1800- XAU/USD Retreats to Support
- Oil Price Outlook: Oil Rips 32% in Eight Weeks- WTI Breakout Levels
- Bitcoin Outlook: BTC/USD Soars into October- Breakout Levels
- Written by Michael Boutros, Currency Strategist with DailyFX
Follow Michael on Twitter @MBForex


