


Gold Technical Price Outlook: XAU/USD Near-term Trade Levels
- Gold price updated technical trade levels – Daily & Intraday Charts
- XAU/USD immediate focus is on breakout of 1568-1586 range- bulls at risk while below
- New to Gold Trading? Get started with this Free How to Trade Gold -Beginners Guide
Gold prices are trading within a well-defined range just below a critical resistance barrier we’ve been tracking for weeks. We’re looking for a price breakout for guidance with the long-bias at risk while below 1586 near-term. These are the updated targets and invalidation levels that matter on the XAU/USD charts heading into the close of January trade. Review my latest Weekly Strategy Webinar for an in-depth breakdown of this gold trade setup and more.
Gold Price Chart - XAU/USD Daily

Chart Prepared by Michael Boutros, Technical Strategist; Gold on Tradingview
Technical Outlook: In my last Gold Price Outlook we noted that the, “ immediate focus is on a breakout of the 1535-62 range for guidance with the risk lower sub-1586..” Price registered a high this at 1588 into the weekly open on Sunday before turning lower with XAU/USD continuing to range just below the 61.8% retracement of the decline off the record 2011 record highs. A breach / close above this threshold exposes subsequent topside resistance objectives at 1595 and the upper parallel, currently near ~1600. Key daily support remains with the 2019 high-day close at 1552. Keep an eye on the pending RSI support trigger in momentum for guidance.
Gold Price Chart - XAU/USD 120min

Notes: A closer look at Gold price action sees XAU/USD trading within the confines of a near-term ascending pitchfork formation with the median-line further highlighting near-term resistance at 1582/86 – look for a reaction there IF reached with a close above needed to keep the long-bias in play. Weekly open support rests at 1571 with a near-term bullish invalidation now raised to 1568. Weakness beyond this threshold would risk a larger correction in gold prices with such a scenario exposing 1555 and critical support at 1548/52.

Bottom line: The immediate focus is on a break of the 1568-1586 range for guidance with the long-bias still vulnerable while below. From a trading standpoint, a good spot to reduce long-exposure / raise protective stops -Respect the break / close. Ultimately, a larger correction may offer more favorable long-entries closer to trend support with the broader focus still higher while above the yearly open. Review my latest Gold Weekly Price Outlook for a closer look at the longer-term XAU/USD technical trading levels.
For a complete breakdown of Michael’s trading strategy, review his Foundations of Technical Analysis series on Building a Trading Strategy
Gold Trader Sentiment – XAU/USD Price Chart
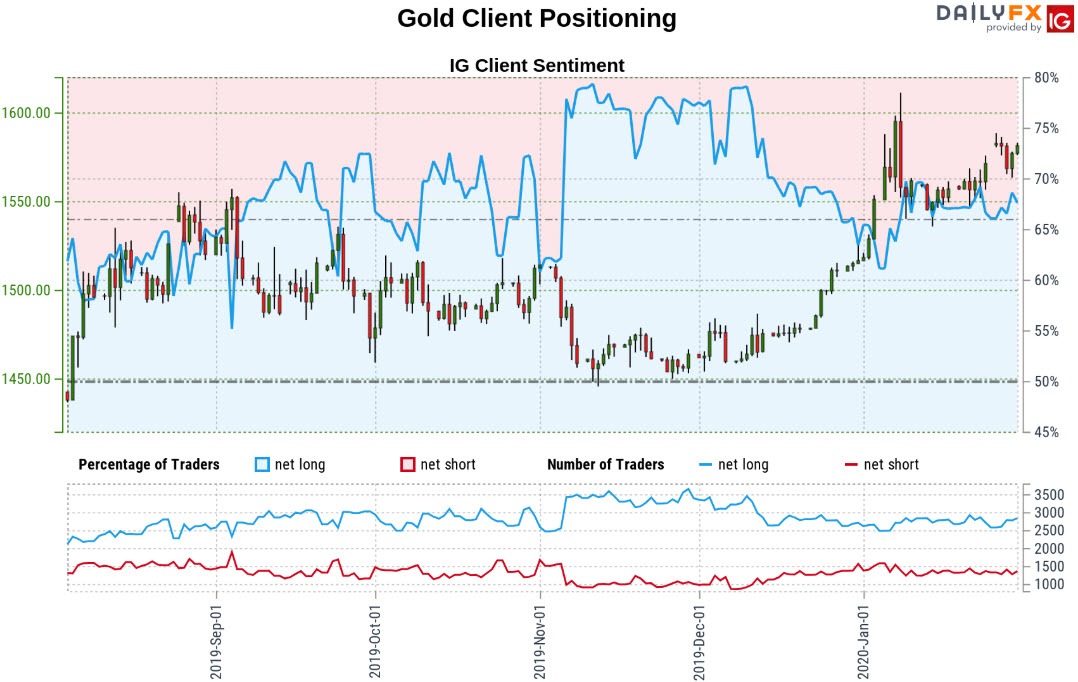
- A summary of IG Client Sentiment shows traders are net-long Gold- the ratio stands at +2.11 (67.85% of traders are long) – bearishreading
- Long positions are0.90% higher than yesterday and 0.75% lower from last week
- Short positions are 8.18% higher than yesterday and 9.72% higher from last week
- We typically take a contrarian view to crowd sentiment, and the fact traders are net-long suggests Gold prices may continue to fall. Yet traders are less net-long than yesterday & compared with last week and the recent changes in sentiment warn that the current Gold price trend may soon reverse higher despite the fact traders remain net-long.
| Change in | Longs | Shorts | OI |
| Daily | 1% | -3% | -1% |
| Weekly | 2% | -8% | -2% |
---
Active Trade Setups
- Euro Price Outlook: EUR/USD Bears to Face FOMC – Trade Levels
- Canadian Dollar Price Outlook: USD/CAD Breakout at Risk into FOMC
- Oil Price Outlook: Crude Sinks 6% – WTI Targets Technical Support
- Sterling Price Outlook: British Pound Breakout Trade- GBP/USD Levels
- Australian Dollar Price Outlook: Aussie Bears Testing AUD/USD Support
- Written by Michael Boutros, Currency Strategist with DailyFX
Follow Michael on Twitter @MBForex


