


Crude Oil Technical Price Outlook: Near-term Trade Levels
- Oil technical trade level update – WTI Daily & Intraday Charts
- Crude Oil price sell-off targeting initial support targets- risk is lower sub-58
- New to Oil Trading? Get started with this Free How to Trade Oil-Beginners Guide
Oil prices plunged more-than 6% this week with the sell-off taking crude towards initial support targets at fresh monthly lows. These are the updated targets and invalidation levels that matter on the crude oil technical charts. Review my latest Weekly Strategy Webinar for an in-depth breakdown of this WTI trade setup and more.
Crude Oil Price Chart – WTI Daily
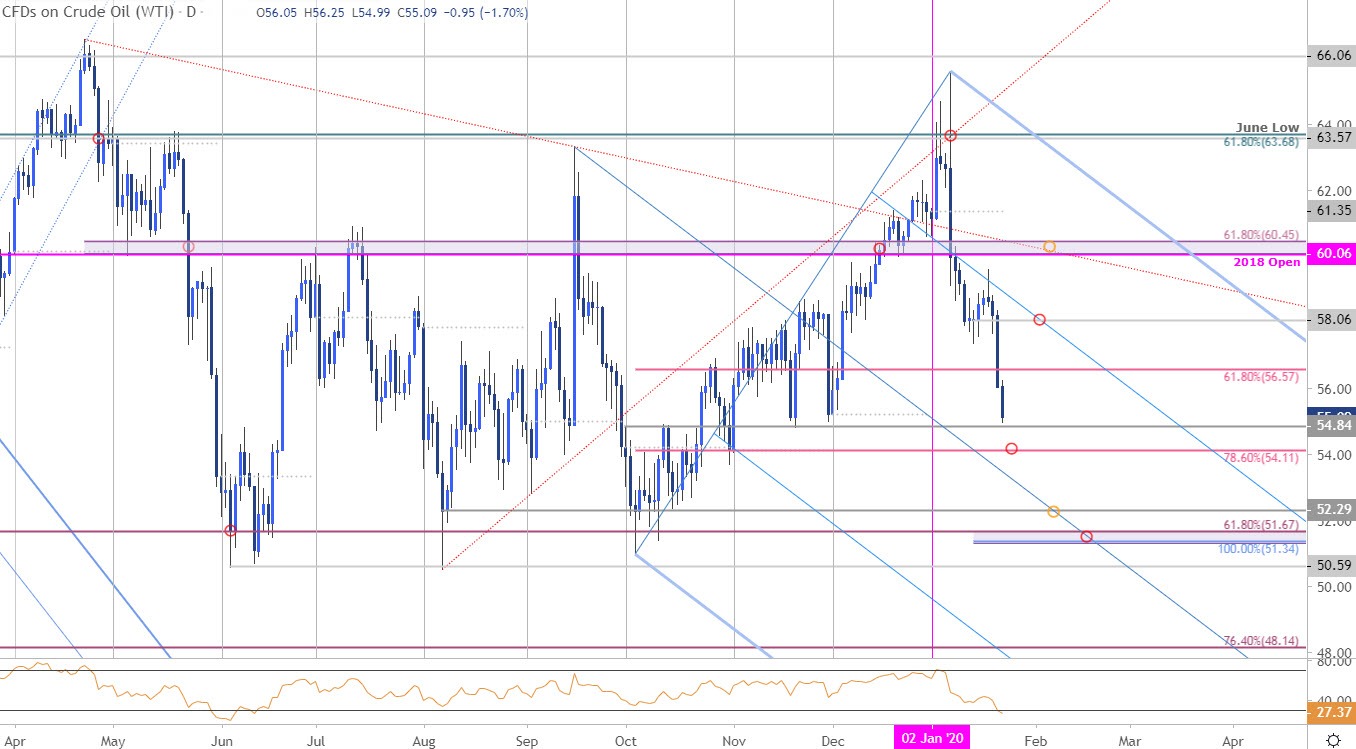
Chart Prepared by Michael Boutros, Technical Strategist; Crude Oil (WTI) on Tradingview
Technical Outlook: In my previous Oil Weekly Price Outlook we noted that WTI was, “testing a major confluence resistance zone at 63.68-64.40 – the immediate long-bias may be vulnerable while below this threshold medium-term.” Four-consecutive tests of this zone failed to mark a daily close above with crude plummeting more than 16% off the highs and the risk for further losses remains while below 58.06.
The decline is now approaching initial daily support targets at 54.84 and 54.11 – a break / close below this threshold is needed to keep the short-bias in play targeting more significant support objectives at August 2019 low-day close (52.29) and the 61.8% retracement / 100% extension at 51.34/67- look for a bigger reaction there IF reached.
Crude Oil Price Chart – WTI 120min
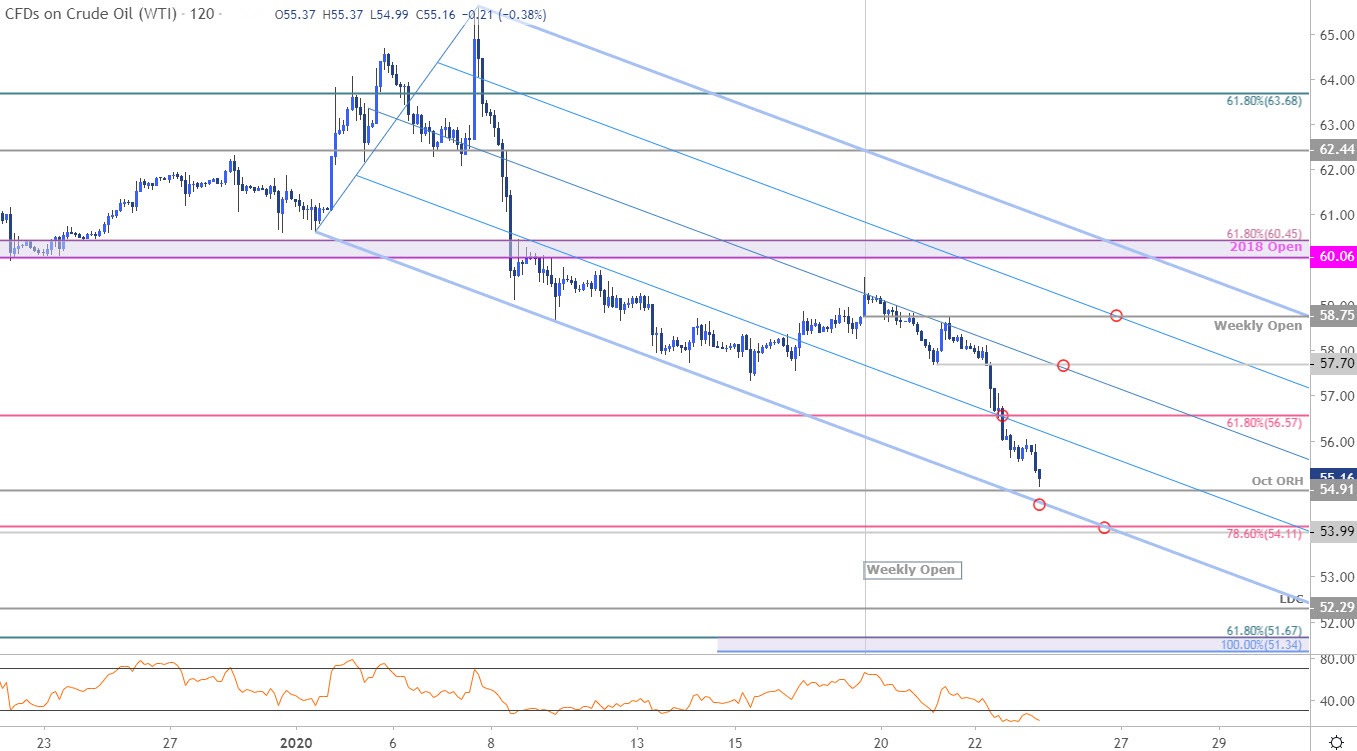
Notes: A closer look at crude oil price action shows WTI trading within the confines of a near-term descending pitchfork formation extending off the monthly highs with the sell-off eyeing initial support targets along the lower parallel at 54.84 and 53.99-54.11 - the immediate decline may be vulnerable into these levels but the focus remains lower while below the median-line. That said, look for initial lateral resistance at 56.57 with near-term bearish invalidation now lowered to 57.70.

Bottom line: The oil price sell-off is taking crude towards initial near-term support targets – look for a reaction on a test of the lower parallel / 54. From a trading standpoint, a good spot to reduce short-exposure / lower protective stops. We’ll look for exhaustion ahead of the median-line for possible entries on rebounds with a break / close lower needed to fuel the next leg in price.
For a complete breakdown of Michael’s trading strategy, review his Foundations of Technical Analysis series on Building a Trading Strategy
Crude Oil Trader Sentiment – WTI Price Chart
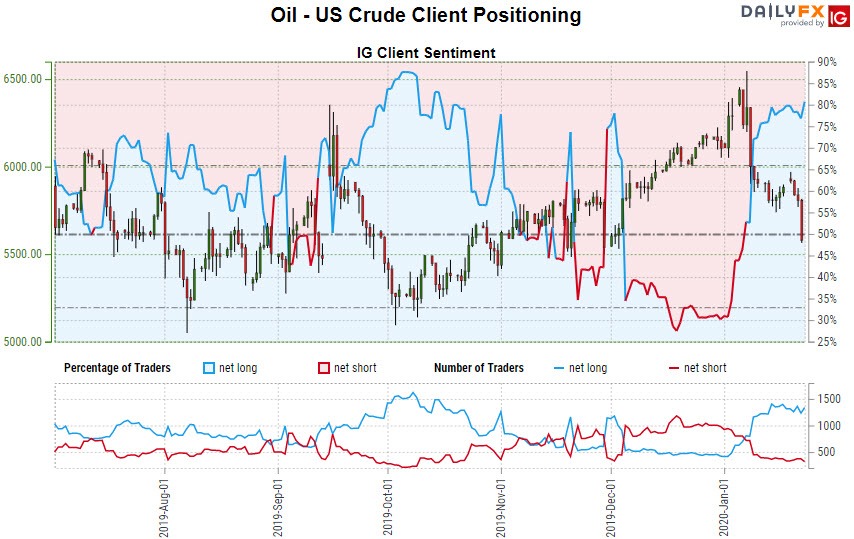
- A summary of IG Client Sentiment shows traders are net-long crude oil - the ratio stands at +4.58 (82.09% of traders are long) – bearish reading
- Long positions are 14.53% higher than yesterday and 2.68% higher from last week
- Short positions are21.09% lower than yesterday and 15.87% lower from last week
- We typically take a contrarian view to crowd sentiment, and the fact traders are net-long suggests crude oil prices may continue to fall. Traders are further net-long than yesterday & last week, and the combination of current positioning and recent changes gives us a stronger Oil - US Crude-bearish contrarian trading bias from a sentiment standpoint.
| Change in | Longs | Shorts | OI |
| Daily | 3% | -7% | 1% |
| Weekly | 31% | -38% | 7% |
---
Active Trade Setups
- Sterling Price Outlook: British Pound Breakout Trade- GBP/USD Levels
- Australian Dollar Price Outlook: Aussie Bears Testing AUD/USD Support
- Gold Price Outlook: XAU/USD at Risk for Further Losses- GLD Levels
- Euro Price Outlook: EUR/USD Rally Eyes Resistance- Dollar at Risk
- Canadian Dollar Price Outlook: USD/CAD Breakout Trade – Loonie Levels
- Written by Michael Boutros, Currency Strategist with DailyFX
Follow Michael on Twitter @MBForex


