


Gold Technical Price Outlook: XAU/USD Near-term Trade Levels
- Gold price in correction off key technical resistance – weekly opening-range breakout in focus
- XAU/USD recoveries remain vulnerable while sub-1586
- New to Gold Trading? Get started with this Free How to Trade Gold -Beginners Guide
Gold prices have plummeted more than 3.8% off the monthly highs with XAU/USD at risk for further losses after reversing off key technical resistance last week. These are the updated targets and invalidation levels that matter on the XAU/USD charts. Review my latest Weekly Strategy Webinar for an in-depth breakdown of this gold trade setup and more.
Gold Price Chart - XAU/USD Daily

Chart Prepared by Michael Boutros, Technical Strategist; Gold on Tradingview
Technical Outlook: In my last Gold Price Outlook we noted that the, “gold rally has stretched into resistance at uptrend extremes and leaves the rally vulnerable while below 1586 – risk for exhaustion here.” XAU/USD is lower by more than 1.5% since with price currently trading right in the middle of the January opening-range. The outlook remains unchanged heading into the close of the week with risk remaining for further losses in gold.
Price is trading just below a resistance pivot zone at 1522/57 with initial support eyed with the median-line of the ascending pitchfork formation we’ve been tracking off the late-2019 lows / 50% retracement of the December advance at 1535. Key daily support rests with the objective yearly open / December 2011 low at 1520 – look for a bigger reaction there IF reached. Ultimately, a breach / close above 1586 is needed to mark resumption of the broader uptrend in Gold.
Gold Price Chart - XAU/USD 120min

Notes: A closer look at Gold price action sees XAU/USD trading within the confines of a near-term descending pitchfork extending off the monthly highs and while its not the cleanest formation at the moment, we’ll use continue to use the slope for guidance in time. Initial weekly open resistance stands at 1562- a breach / close above the objective weekly open-range high would shift the focus back towards the upper parallels of this formation. Watch this pivot around 1550 with a break below 1535 exposing 1520 and the 61.8% Fibonacci retracement at 1509- both areas of interest for possible downside exhaustion on a stretch lower IF reached.

Bottom line: The immediate focus is on a breakout of the 1535-62 range for guidance with the risk lower sub 1586 heading into the close of the week. From a trading standpoint, look for topside exhaustion on recoveries while below the median-line with a break of the weekly opening-range needed to fuel the next leg lower in in price. Review my latest Gold Weekly Price Outlook for a closer look at the longer-term XAU/USD technical trading levels.
For a complete breakdown of Michael’s trading strategy, review his Foundations of Technical Analysis series on Building a Trading Strategy
Gold Trader Sentiment – XAU/USD Price Chart
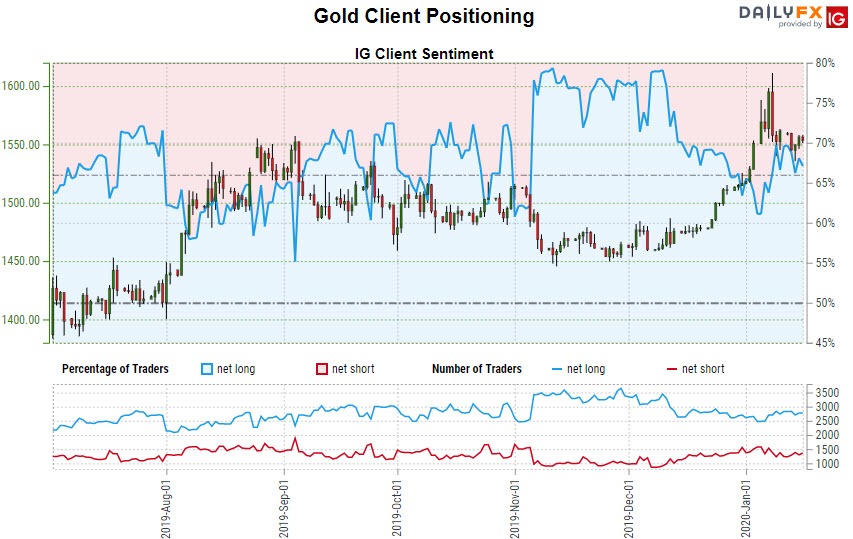
- A summary of IG Client Sentiment shows traders are net-long Gold- the ratio stands at +2.06 (67.3% of traders are long) – bearishreading
- Long positions are0.74% higher than yesterday and 11.21% higher from last week
- Short positions are 1.75% higher than yesterday and 0.71% lower from last week
- We typically take a contrarian view to crowd sentiment, and the fact traders are net-long suggests Gold prices may continue to fall. Traders are less net-long than yesterday but more net-long from last week and the combination of current positioning and recent changes gives us a further mixed Gold trading bias from a sentiment standpoint.
| Change in | Longs | Shorts | OI |
| Daily | -1% | -4% | -2% |
| Weekly | -1% | -9% | -5% |
---
Active Trade Setups
- Euro Price Outlook: EUR/USD Rally Eyes Resistance- Dollar at Risk
- Australian Dollar Price Outlook: Aussie Range Break to Offer Guidance
- Canadian Dollar Price Outlook: USD/CAD Breakout Trade – Loonie Levels
- Sterling Price Outlook: British Pound Sinks into Support– GBP Levels
- Written by Michael Boutros, Currency Strategist with DailyFX
Follow Michael on Twitter @MBForex


