


- Gold price breakout testing key multi-year resistance amid Iranian War headlines
- XAU/USD breakout vulnerable with the rally at risk for exhaustion sub-1586
- New to Gold Trading? Get started with this Free How to Trade Gold -Beginners Guide
Gold prices surged nearly 6% since the start of the year with XAU/USD now testing critical multi-year technical resistance. While the broader outlook remains weighted to the topside, the advance may be vulnerable near-term while below this critical threshold. These are the updated targets and invalidation levels that matter on the XAU/USD charts. Review my latest Weekly Strategy Webinar for an in-depth breakdown of this gold price setup and more.
Gold Price Chart - XAU/USD Daily
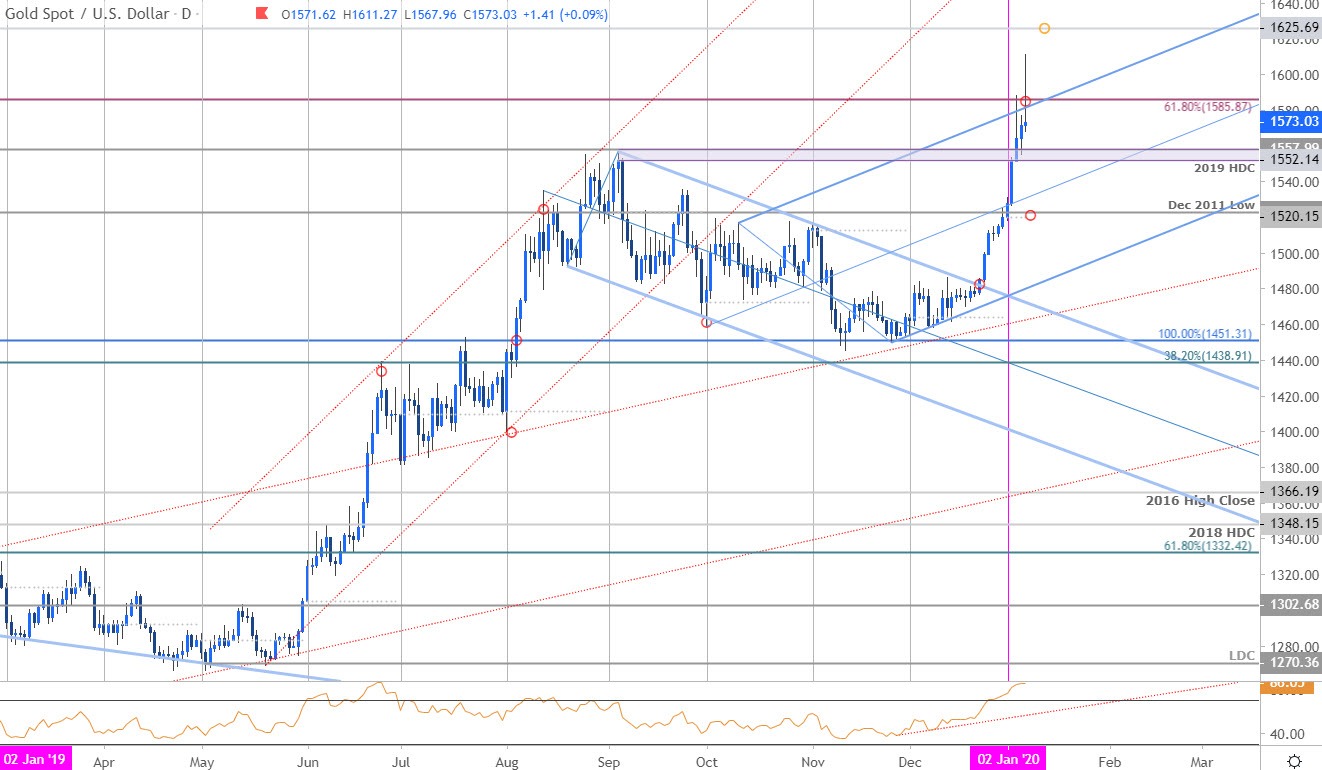
Chart Prepared by Michael Boutros, Technical Strategist; Gold on Tradingview
Technical Outlook: In my latest Gold Weekly Price Outlook we noted that the XAU/USD, “price breakout is now approaching targets into uptrend resistance - look to reduce long-exposure / raise protective stops on a rally into the upper parallels.” Price registered a high at 1611 today before reversing sharply and the risk remains for a deeper pullback while below pitchfork resistance / the 61.8% retracement of the decline off the record highs in gold at 1586- a breach / daily close above this threshold is needed to mark resumption of the broader uptrend targeting 1625. Initial daily support now rests a 1522/58 with broader bullish invalidation now raised to the objective monthly open / December 2011 low at 1520.
Gold Price Chart - XAU/USD 240min

Notes: A closer look at gold price action highlights today’s failed attempt to breach resistance with XAU/USD pulling back below the 1586 resistance zone on building momentum divergence. While it’s too early to rely on this downslope, we’ll use it as a reference for now with a break sub-1547 needed to validate a larger near-term correction in price targeting the median-line, currently nearly 1530s and 1522- both levels of interest for possible exhaustion.A break / close below the 61.8% retracement at 1508 would be needed to put the bears back in control- look for a bigger reaction there IF reached on a spike.

Bottom line: The gold rally has stretched into resistance at uptrend extremes and leaves the rally vulnerable while below 1586 – risk for exhaustion here. From a trading standpoint, a good spot to reduce long-exposure / raise protective stops. Look for topside exhaustion while below the weekly highs – ultimately a larger correction may offer more favorable long-entries closer to uptrend support.
For a complete breakdown of Michael’s trading strategy, review his Foundations of Technical Analysis series on Building a Trading Strategy
Gold Trader Sentiment – XAU/USD Price Chart

- A summary of IG Client Sentiment shows traders are net-long Gold- the ratio stands at +2.03 (66.99% of traders are long) – bearishreading
- Long positions are9.13% higher than yesterday and 12.82% higher from last week
- Short positions are 5.67% lower than yesterday and 5.23% higher from last week
- We typically take a contrarian view to crowd sentiment, and the fact traders are net-long suggests Gold prices may continue to fall. Traders are further net-long than yesterday & last week, and the combination of current positioning and recent changes gives us a stronger Gold-bearish contrarian trading bias from a sentiment standpoint.
| Change in | Longs | Shorts | OI |
| Daily | 1% | -3% | -1% |
| Weekly | 2% | -8% | -2% |
---
Active Trade Setups
- Canadian Dollar Outlook: USD/CAD Plummets into Support– Loonie Levels
- Japanese Yen Price Outlook: USD/JPY Breakout Levels- Resistance Ahead
- Euro Price Outlook: EUR/USD Battle Lines Drawn ahead of FOMC
- Written by Michael Boutros, Currency Strategist with DailyFX
Follow Michael on Twitter @MBForex


