


- USD/JPY rebound targeting monthly / yearly open resistance targets
- Check out our 2019 projections in our Free DailyFX USD/JPY Trading Forecasts
- Join Michael for Live Weekly Strategy Webinars on Mondays at 12:30GMT
The Japanese Yen is down more than 0.65% against the US Dollar this week with USD/JPY rallying back towards a critical resistance zone we’ve been tracking for months now. These are the updated targets and invalidation levels that matter on the USD/JPY weekly price chart. Review my latest Weekly Strategy Webinar for an in-depth breakdown of this gold price setup and more.

Japanese Yen Price Chart – USD/JPY Daily
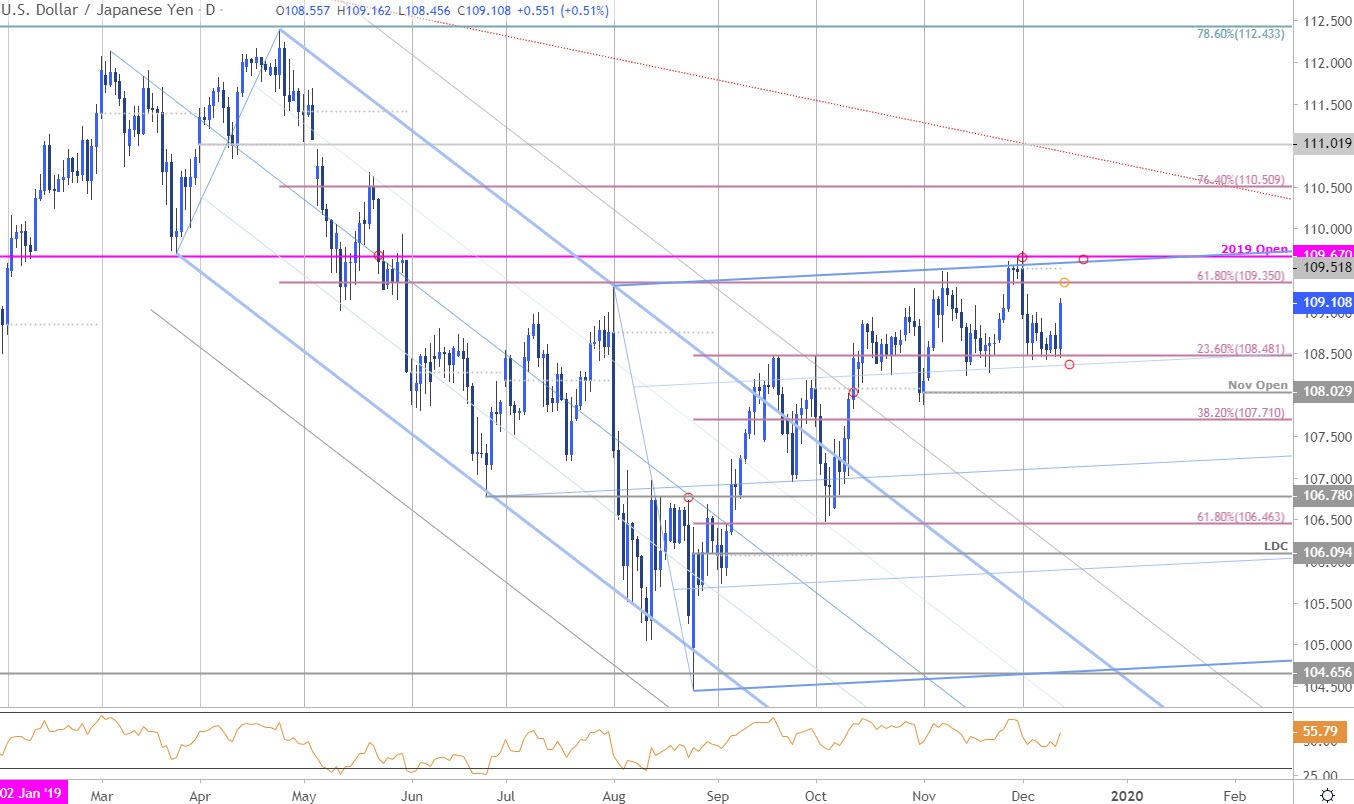
Chart Prepared by Michael Boutros, Technical Strategist; USD/JPY on Tradingview
Notes: In my latest Japanese Yen Weekly Price Outlook we noted that USD/JPY was, “once again testing critical yearly open resistance at 109.68 and we’re looking for a reaction.” Price registered a high at 109.72 before reversing sharply lower with the decline rebounding off Fibonacci support at the 23.6% retracement of the August advance at 108.48. Price is poised to mark an outside daily-reversal candle off this threshold today with USD/JPY again targeting the 61.8% retracement at 109.35. Note that daily RSI has continued to hold above the 40-threshold since the August lows and keeps the broader momentum profile on the side of the bulls for now.
Japanese Yen Price Chart – USD/JPY 120min
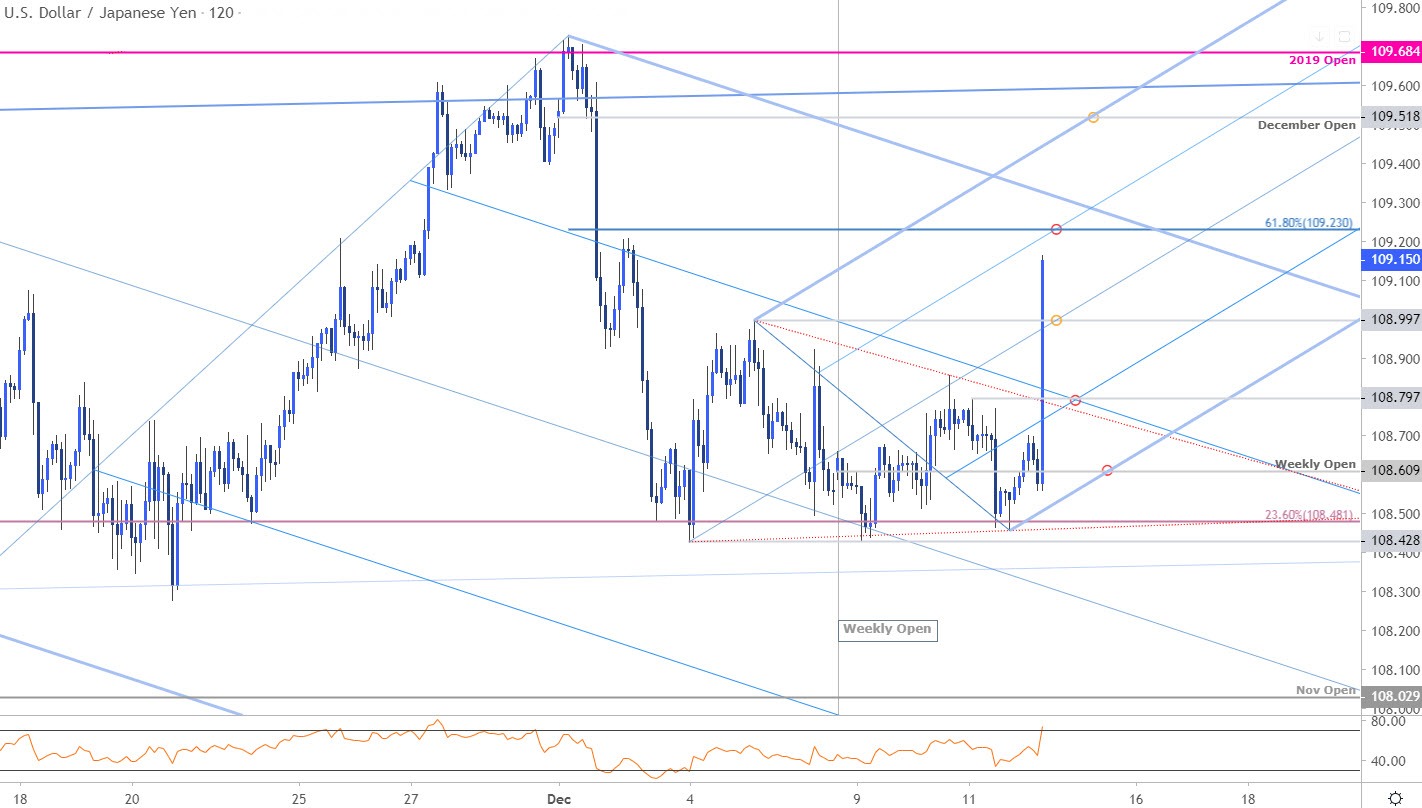
Notes: A closer look at Japanese Yen price action shows USD/JPY trading within the confines an ascending pitchfork formation extending off the monthly lows. A topside breach of the weekly opening-range today keeps the focus on topside resistance targets at 109.23 backed by broader downtrend slope resistance near ~109.30s – look for a reaction / possible exhaustion there IF reached.
Initial support now rests at the median-line / 109-handle with near-term bullish invalidation now raised to 108.80. A topside breach from here would likely see an accelerated rally with such a scenario exposing the upper parallel / monthly open resistance at 109.52 and the yearly open at 109.68.
Why does the average trader lose? Avoid these Mistakes in your trading
Bottom line: A breach of the opening-range keeps the focus higher in USD/JPY into the close of the week, but the recovery is now approaching resistance hurdles that could interrupt the rally. From a trading standpoint, look to reduce long-exposure / raise protective stops on a move towards the upper parallel- look for a larger reaction there (high exhaustion risk). IF this rally is a larger turn in price, pullbacks should be limited to the 25% parallel / 108.80. Ultimately a break below weekly open support at 108.60 would be needed to mark resumption of the broader downtrend. Review my latest Japanese Yen Price Weekly Outlook for a closer look at the longer-term USD/JPY technical trading levels.
For a complete breakdown of Michael’s trading strategy, review his Foundations of Technical Analysis series on Building a Trading Strategy
Japanese Yen Trader Sentiment – USD/JPY Price Chart

- A summary of IG Client Sentiment shows traders are net-long USD/JPY - the ratio stands at +1.43 (58.71% of traders are long) – bearish reading
- Long positions are0.49% lower than yesterday and 16.80% higher from last week
- Short positions are 0.99% higher than yesterday and 4.05% lower from last week
- We typically take a contrarian view to crowd sentiment, and the fact traders are net-long suggests USD/JPY prices may continue to fall. Traders are less net-long than yesterday but more net-long from last week and the combination of current positioning and recent changes gives us a further mixed USD/JPY trading bias from a sentiment standpoint.
| Change in | Longs | Shorts | OI |
| Daily | -16% | 5% | 0% |
| Weekly | 20% | -13% | -8% |
---
Active Trade Setups
- Gold Price Forecast: XAU/USD Support Rebound to Face FOMC- GLD Levels
- Euro Price Outlook: EUR/USD Battle Lines Drawn ahead of FOMC
- Canadian Dollar Outlook: USD/CAD Bulls at Risk – Loonie Trade Levels
- Australian Dollar Price Outlook: Aussie Challenges Key Technical Support
- US Dollar Price Outlook: USD Recovery Trade – DXY Trade Levels
- Written by Michael Boutros, Currency Strategist with DailyFX
Follow Michael on Twitter @MBForex


